Prediction markets aren’t the only place where traders are betting on a Democratic sweep.
Over the weekend, we laid out Goldman’s case that gas prices are steering the midterms, with Polymarket pricing a roughly 65% chance that Democrats take both chambers, a number the bank’s own historical work suggests is too high.
But for those who prefer their political bets with a ticker and a prime broker attached, there is another, far more lucrative gauge of how Wall Street sees November 3: JPMorgan’s Democrat Factor (JP9DEMP Index on Bloomberg), a beta-neutral long/short equity pair built to move with the Democrats’ odds, and nothing else.
It has done exactly that. Since August, the pair is up roughly 20%. Over the same period the S&P 500 rose 2.6%. Scaled up to a 6% volatility target, JPMorgan’s Delta-One desk calculates that the Democrat Factor has generated ~170% annualized, a return that would make even the most die-hard AI longs green with envy (although lately that would be red).

In other words, the blue wave is already a trade, and a crowded one at that.
Read on as we explain what is inside JPMorgan’s election factor, why it has been tracking Polymarket tick for tick, and why the S&P 500, which is sitting just shy of record highs, has priced almost none of the outcome that BofA’s Michael Hartnett says would send it 10% lower.
What Is The “Democrat Factor”?
The construction was laid out by JPM’s Delta-One strategist Manish Sinha in the bank’s “US Election Series – Midterms: September 30, 2026” note (available to pro subs). The idea predates this election: JPM first built the framework during the 2024 presidential race, and dusted it off for the midterms. The process, as JPM describes it, is to score a universe of roughly 3,000 US stocks by how each reacts to changes in Polymarket’s odds, assign each one an “Election Score” for its sensitivity to Democratic versus Republican chances, then optimize the results into two liquid long/short pairs:
The Republican pair (JP9REPP) and Democratic pair (JP9DEMP) are designed to be beta-neutral, aiming to capture election-related idiosyncratic movements. The model also allows us to evaluate a portfolio’s direct exposure to Democratic versus Republican factors ahead of the midterm election. This provides a framework to hedge anticipated election uncertainty and to reduce overall risk and directional exposure.
The Democratic pair goes long JP9DEML and shorts JP9DEMS; the Republican pair is the mirror image (long JP9REPL, short JP9REPS). Here is how the two looked at the end of September, overlaid on Polymarket’s Senate odds for each party: the Dem factor up 19.45% as Democratic Senate odds jumped above 60%, the Republican factor down 14.57% as GOP odds collapsed.

The more important point is what the factor doesn’t contain. JPM’s attribution shows that the move is almost entirely idiosyncratic, i.e., stock-specific, with “limited explanatory power from traditional risk factors.” The green “Factors” line in the chart below has barely moved since March; virtually all of the August-September surge comes from the red “Idiosyncratic” line.

Translation: this is a pure election bet, unaffected by the AI trade, by momentum, by rates and by beta, and that is precisely why the desk has been pitching it to institutional investors in size.
Tracking Polymarket Tick For Tick
On October 7, with markets digesting what JPM called non-consensus risks in Res Vol and Momentum, Sinha flagged one factor that had held up no matter what:
Regardless of shifting conditions, our Democratic factor (JP9DEMP Index) has continued to show strength as we move closer to the mid-terms. It’s up ~20% since August, and that move appears broadly neutral to Beta, Momentum, and other factors.
TRADE – A tactical long in (JP9DEMP Index) could add alpha into the election—especially if Polymarket’s continues to trend in Democrats’ favor.
The chart that accompanied the note shows why: since the summer the factor (black, right axis) and Polymarket’s Democratic Senate odds (orange, left axis, last at 65%) have been nearly indistinguishable, with the factor up 21.9% from its July trough.

A day later, in a JPM S&T factor risk note, that recommended buying protection into year-end and earnings given a negative equity risk premium, Sinha slotted “Long Democrat Pair JP9DEMP” right next to his hedges, noting it “has been tracking Polymarket odds” and “could be a tactical election trade if Polymarket odds keep moving toward Democrats.” By this morning’s JPM Market Intel briefing the pitch had become a scoreboard: a 6-vol Democrat Factor strategy has generated ~170% annualized returns since August, compared to ~15% annualized for the ~15%-vol S&P, which Sinha says “suggests a meaningful shift in where alpha is being realized, likely driven by election dynamics.”
Some napkin math: both numbers describe the same ~20% move. 20% in roughly ten weeks annualizes to the high-100s, and the 6-vol scaling just puts it on the same risk footing as the index. Impressive, but nobody should read it as an eight-bagger in four trading days.
Which brings us to the obvious problem with a factor whose only input is a probability.
From 23% To 64%… And Possibly Back To 58%
The Democrat Factor has worked because the odds have moved, and they have moved a lot. In August, just 23% of fund managers in BofA’s FMS expected a Democratic sweep; 47% expected the “GOP Senate & DEM House” split. By Sep 4, Kalshi had a sweep at 47% (as we noted in “Democrat Sweep? Here Are JPMorgan’s Midterm Trades – And Why Gridlock Pays”), and three days later we flagged that Polymarket’s odds had hit a record:
Odds of a Dem midterm sweep hit all time high 52% https://t.co/O7Iv4Va96b
— zerohedge (@zerohedge) September 7, 2026
By Sep 29, Goldman’s average of Kalshi and Polymarket hit ~65% on Oct 8, and in his latest “Midterms, Bidterms, Skidterms” Flow Show (available for pro subs), Hartnett had Polymarket at 64% for a sweep, up from 49% in September, against 28% for the GOP Senate/Dem House split and just 9% for a GOP sweep:

Put the snapshots side by side and the shift is stark: a sweep went from a 1-in-4 fringe call among fund managers to the market’s base case in under two months.

The last bar is where it gets interesting for anyone long the factor. As we detailed yesterday, in the bank’s “US Election Monitor: October 8 Update” (also available to pro subs) Goldman’s Alec Phillips found that in past midterms (2002, 2006, 2010, 2018, 2022), prediction markets “have tended to overstate the challenging party’s sweep odds at this point in the cycle”, with the average fade from early October to Election Day about 5 points:
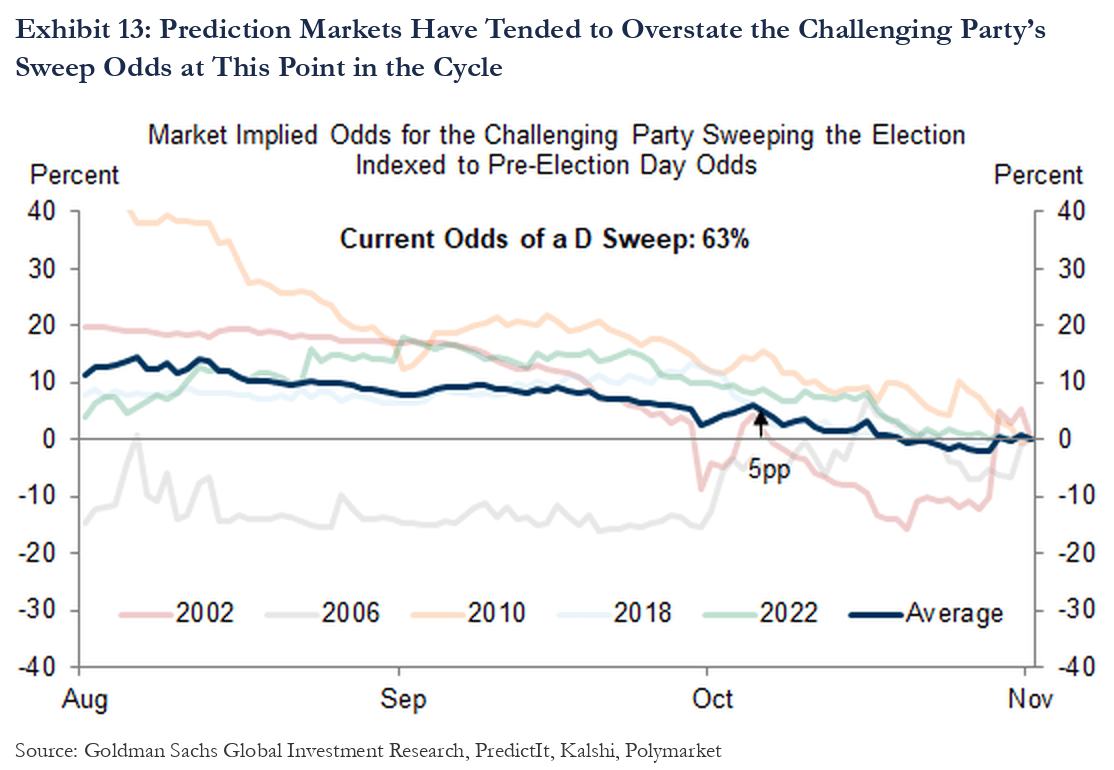
Apply the average fade to Goldman’s 63% (exhibit above) and a sweep drops to the high 50s. Still the favorite, but if JP9DEMP keeps tracking Polymarket the way it has, a 5-point slide in the odds is a meaningful drawdown for what is now a 20% winner, and potentially a winning arb.
And the risk is lopsided. The odds can’t go above 100%, while the polls behind the Senate math are anything but solid. Goldman notes that midterm polls “tend to understate Democrats in Democratic-leaning states and Republicans in Republican-leaning states”, consistent with red-state voters “coming home” late, and the Senate majority runs right through Alaska, Texas, Ohio, Iowa and Kansas. Meanwhile, CNN’s Harry Enten found that Republicans hold their best party registration position in a midterm year in at least 20 years in Arizona, Nevada, North Carolina and Pennsylvania, a metric he called “pretty gosh darn good” for the GOP.
Put differently, the trade that worked because the odds went from coin flip to base case now needs the odds to go from base case to lock.
What Exactly Is Wall Street Long?
JPM doesn’t publish the constituents of JP9DEML and JP9DEMS. But the bank’s Delta 1 thematic team (Kaitlyn Bowman and Priyanka Thapa) does spell out what a Democratic Congress would mean at the policy level in its scenario basket JPMDC26P, which we first discussed in early September: long ACA exchange-exposed managed care and hospitals (enhanced premium tax credits get extended) and low-end consumer spending (affordability support); short SMID-cap defense, capital-markets-exposed names (oversight and investigations replace deregulation), energy permitting beneficiaries and anything riding on the CLARITY Act.

That last short has already had a dress rehearsal. When the Senate killed the crypto market-structure bill in mid-September, every Democrat voted no, and we made the obvious extrapolation:
Senators voted 49-50 to reject the so-called Clarity Act Every Democrat voted against the measure. Three Republicans – Sens. Susan Collins of Maine, Josh Hawley of Missouri and Jerry Moran of Kansas – also voted against the measure. If Dems sweep, data centers are next.
— zerohedge (@zerohedge) September 15, 2026
Hartnett makes the same point with a broader brush: a Democratic sweep “signals electoral shift from populist capitalism to populist socialism” and means “next big direction in tax & regulation up not down (EPS negative).” His preferred hedge, as we first reported on Sep 5, is short financials and the US dollar, which overlaps neatly with JPM’s short capital markets leg.
Gridlock Is Good… Unless It’s A Sweep
So the election trade is crowded in prediction markets and in the factor space. What about the index? Here the sell-side splits into two camps.
Camp one says relax. JPM’s Andrew Tyler argues that even a Blue Wave would fall well short of the two-thirds majorities needed to override a presidential veto, so the result would be gridlock “similar to Biden’s last 2 years, Trump 1.0’s last 2 years, and Obama’s last 2 years”, which markets “typically react favorably to.”
His conclusion: “Any dip creating around the election, we would be buyers” and history is on his side. Per JPM, the S&P has rallied on average 5.4%, 11.4%, 12.5% and 14.7% at 3, 6, 9 and 12 months after midterm election days since 1990, and all 19 midterms since 1950 showed positive returns 6, 9 and 12 months out.
Goldman’s IBD team calls the midterms a potential “clearing event”, noting that stocks have historically underperformed into the vote (a median 3.5% decline in the month before since 1974) and outperformed after (a median 6.5% gain over the following four months). Tony Pasquariello made the same point back in August with Ben Snider’s analog: 12 of the last 13 midterms saw the market higher from Election Day through the end of February.
Camp two says the base case is the bear case. Hartnett’s scenario map: a Democratic sweep is “big risk-off”, with “stocks skid >10%”, the dollar and yields falling into year-end and international stocks outperforming. A GOP Senate/Dem House split is risk-on (stocks +5%, “Gridlock = Goldilocks”), and a GOP sweep would be the most bullish surprise of all. Goldman’s custom basket head Louis Miller is in the same camp, warning earlier this month that “midterms beckon and the result probably won’t be risk positive.”

Note the problem: the average historical outcome bakes in plenty of gridlock, while the outcome now priced at roughly two-in-three is precisely the one Hartnett says breaks the pattern. In August, when the FMS expected the split, the two camps agreed. Now they don’t, because the market’s base case has moved from Hartnett’s “risk-on” scenario to his “risk-off” one.
And yet the index hasn’t blinked. US stocks are up 13.4% YTD per Hartnett’s scoreboard, and JPM’s own chart shows the S&P up just 2.6% since August while the Democrat Factor ripped 20%. The election risk has been isolated, packaged into a beta-neutral pair, and traded as alpha, and the rest of the tape (held up, as Miller put it, by the AI trade) has been left to assume gridlock.
Bottom Line
Sinha’s summary of the trade is hard to argue with:
Where is the market’s alpha headed into the midterm? A 6-vol Democrat Factor (JP9DEMP Index) pure-alpha strategy has generated ~170% annualized returns since August. … This suggests a meaningful shift in where alpha is being realized, likely driven by election dynamics.
Our take is less enthusiastic. The Democrat Factor has been a spectacular way to monetize the odds moving from a coin flip to the base case, but with Polymarket at 64%, Goldman’s history pointing to a ~5-point fade, red-state polls that have historically flattered Democrats, and a gas price that could break either way (Trump has already ruled out striking Iran before Nov 3), the easy money in the factor has been made. The bigger mispricing sits on the other side of the ledger: an index that has priced a sweep in prediction markets and in a pair trade, but not in the S&P itself.
If Hartnett is right that a sweep means a 10% skid, the cheapest election hedge on the board is downside protection on an index that still trades as if the split is the base case. Then again, with 22 days to go, it may be that the only thing the market truly believes in is gridlock = goldilocks… and gas below $4.
Much more in the full JPMorgan “US Election Series – Midterms” note, the Goldman “US Election Monitor: October 8 Update” and the BofA “Midterms, Bidterms, Skidterms” Flow Show, all available to pro subs.
Tyler Durden
Fri, 10/16/2026 – 12:25