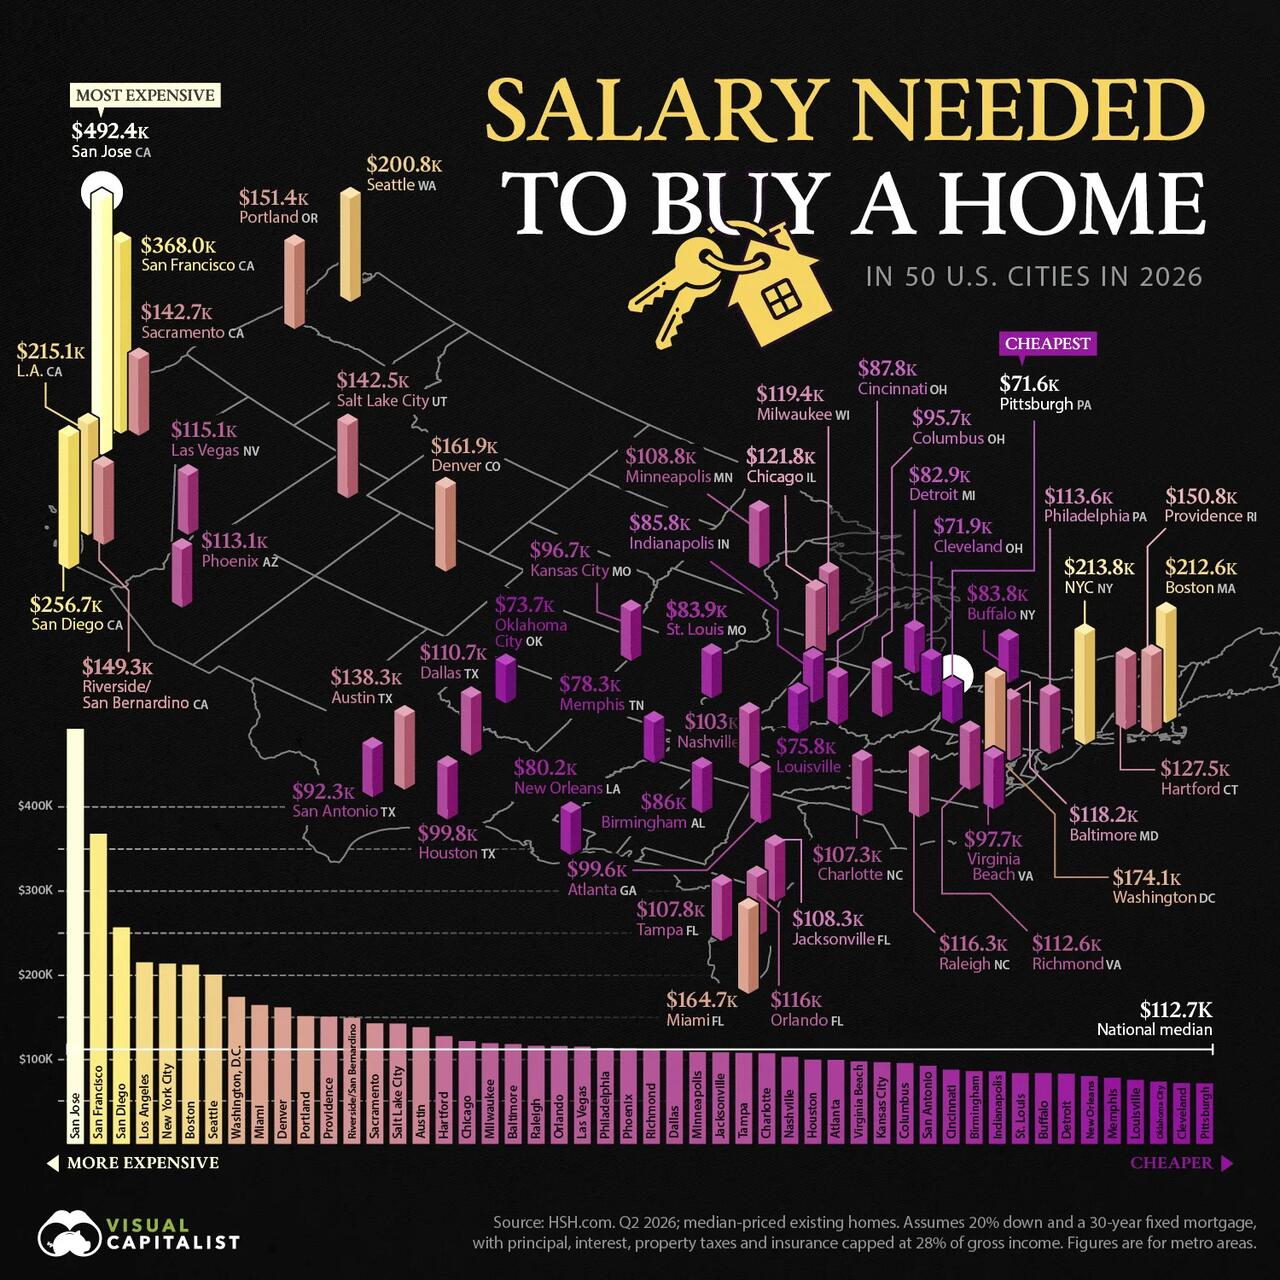
Buying the national median-priced home ($434,900, per HSH.com‘s second-quarter 2026 data) takes an income of $112,695 a year with 20% down ($347,920 borrowed) at a 6.41% mortgage rate. That is $9,213 more than in the first quarter, and HSH says affordability worsened in all 50 of the large metros it tracks over the quarter. It is still $1,273 below the second-quarter 2025 figure.
San Jose tops the ranking at $492,364 a year, nearly seven times Pittsburgh’s $71,567. San Francisco ($367,973), San Diego ($256,735) and Los Angeles ($215,136) follow, and New York City, Boston and Seattle also need more than $200,000. A six-figure income is required in 32 of the 50 metros.
The strain is already visible in transactions. Pending home sales fell to record lows in September, and existing home sales are hovering near record lows as the affordability gap widens.

As Visual Capitalist explains further,
In coastal California, much of what buyers pay for is the land itself. Land accounted for 59% to 68% of a single-family home’s value in the San Jose, San Francisco, Los Angeles, and San Diego metros in 2022, compared with 40% nationally and 22% in Pittsburgh, according to FHFA estimates.
In Most Metros, Typical Households Earn Too Little to Buy
Nationally, buyers needed $112.7K a year, about 29% more than the 2025 U.S. median household income of $87.5K, according to the Census Bureau.
The gap between home prices and household incomes is especially striking in San Jose. Although the typical household earns roughly twice the national median, the median home costs nearly five times as much as the national median. As a result, the typical local household earns only about one-third of the income needed to buy a median-priced home.
At the other end of the ranking, these five metros require the lowest salaries:
- Pittsburgh: $71.6K
- Cleveland: $71.9K
- Oklahoma City: $73.7K
- Louisville: $75.8K
- Memphis: $78.3K
Based on 2024 Census data, the latest available by metro area, median household incomes in Oklahoma City and Louisville fell short of the required salaries by less than 2%.
Homebuying Got Easier in the South and West
Compared with Q2 2025, the income needed fell in 30 of the 50 metros as the average 30-year mortgage rate dropped from 6.79% to 6.41%.
However, the required income rose in 13 of the 17 Midwest and Northeast metros, led by St. Louis (+3.8%), Hartford (+3.6%), and Providence (+3.3%). Even Pittsburgh and Cleveland, the two cheapest markets, became less affordable.
New construction helps explain the regional divide. The South and West accounted for 79% of single-family housing starts in 2025, despite holding about 63% of the U.S. population, according to Census Bureau data. All 10 metros where home prices fell were also in those two regions.
The table below shows how the income needed and median home prices changed in each metro from Q2 2025 to Q2 2026:
| Metro Area | State | Region | Change, Q2 2025 to Q2 2026 (%): Income Needed to Buy a Home | Change, Q2 2025 to Q2 2026 (%): Median Home Price |
|---|---|---|---|---|
| St. Louis | MO | Midwest | 3.76 | 6.22 |
| Hartford | CT | Northeast | 3.56 | 7.97 |
| Providence | RI | Northeast | 3.28 | 7.43 |
| Pittsburgh | PA | Northeast | 2.95 | 6.78 |
| Milwaukee | WI | Midwest | 2.93 | 6.85 |
| New York City | NY | Northeast | 2.53 | 6.03 |
| Jacksonville | FL | South | 2.45 | 5.43 |
| Detroit | MI | Midwest | 2.45 | 6.09 |
| Cleveland | OH | Midwest | 2.44 | 6.20 |
| Kansas City | MO | Midwest | 2.37 | 4.45 |
| Cincinnati | OH | Midwest | 2.18 | 5.53 |
| Chicago | IL | Midwest | 2.05 | 5.74 |
| San Francisco | CA | West | 1.73 | 5.19 |
| San Diego | CA | West | 1.21 | 4.88 |
| Virginia Beach | VA | South | 0.91 | 3.98 |
| Buffalo | NY | Northeast | 0.75 | 3.45 |
| Richmond | VA | South | 0.63 | 3.79 |
| New Orleans | LA | South | 0.46 | 2.15 |
| Columbus | OH | Midwest | 0.18 | 3.21 |
| Tampa | FL | South | 0.16 | 2.47 |
| Baltimore | MD | South | -0.02 | 3.01 |
| Memphis | TN | South | -0.03 | 3.00 |
| Indianapolis | IN | Midwest | -0.39 | 2.20 |
| Birmingham | AL | South | -0.41 | 2.95 |
| Philadelphia | PA | Northeast | -0.46 | 3.73 |
| Miami | FL | South | -0.61 | 2.01 |
| Louisville | KY | South | -1.06 | 1.95 |
| Sacramento | CA | West | -1.08 | 1.82 |
| Charlotte | NC | South | -1.12 | 0.56 |
| Atlanta | GA | South | -1.43 | 0.91 |
| Salt Lake City | UT | West | -1.44 | 2.24 |
| Boston | MA | Northeast | -1.68 | 1.28 |
| San Antonio | TX | South | -1.80 | -0.31 |
| Oklahoma City | OK | South | -1.94 | 0.15 |
| Washington | DC | South | -1.98 | 0.92 |
| Orlando | FL | South | -2.04 | 0.04 |
| Denver | CO | West | -2.27 | 0.16 |
| Raleigh | NC | South | -2.32 | -0.83 |
| Minneapolis | MN | Midwest | -2.35 | 0.53 |
| Phoenix | AZ | West | -2.57 | 0.65 |
| Houston | TX | South | -2.60 | -1.20 |
| Dallas | TX | South | -2.76 | -0.68 |
| Las Vegas | NV | West | -2.85 | 0.25 |
| Austin | TX | South | -2.89 | -1.30 |
| Los Angeles | CA | West | -2.90 | 0.00 |
| Portland | OR | West | -3.38 | -0.60 |
| Riverside/San Bernardino | CA | West | -3.51 | -0.82 |
| Nashville | TN | South | -4.17 | -1.41 |
| Seattle | WA | West | -4.89 | -2.28 |
| San Jose | CA | West | -6.67 | -4.16 |
Rising mortgage rates have since erased much of that relief. Freddie Mac’s average 30-year mortgage rate reached 7.40% in October 2026, its highest level since November 2023 and nearly a full percentage point above the Q2 average.
At that rate, buying the national median-priced home would require an annual income of approximately $122.6K, nearly $10K more than the Q2 figure. This illustrates how quickly borrowing costs can change affordability, even without a corresponding increase in home prices.