62.1 F
Chicago
Tuesday, September 22, 2026
Home Blog Page 2583

Strong Indian Purchases Push Asia’s Crude Imports To One-Year High

Strong Indian Purchases Push Asia’s Crude Imports To One-Year High

Authored by Tsvetana Paraskova via OilPrice.com,

Record-high crude imports in India have pushed Asia’s oil arrivals in May to the highest level in a year, per data compiled by LSEG Oil Research and cited by Reuters columnist Clyde Russell.

Asia, the key crude oil importing region and a gauge of oil demand trends, is set to welcome in May 27.81 million barrels per day (bpd) of crude oil volumes, nearly 1 million bpd higher than the April imports, per the LSEG Oil Research data.   

Most of the 920,000-bpd growth in Asia’s estimated crude oil imports this month has been thanks to a 710,000-bpd surge in volumes shipped to India, which is back to importing increased volumes of cheaper Russian crude oil.

India is estimated to see its crude imports jump to a record-high of 5.26 million bpd in May, up by 710,000 bpd from 4.55 million bpd of crude imported in April, according to the data compiled by LSEG Oil Research.

While India is leading Asia’s crude imports higher, China is again showing signs of weaker import demand. The world’s top crude oil importer is expected to haul in 10.72 million bpd of crude in May, down from the 10.93 million bpd imports in April and the lowest per-day volumes since January, Reuters’ Russell notes.

The stronger Indian economy compared to China and the renewed appetite from Indian refiners for Russian crude – after hesitation earlier this year when stricter U.S. sanctions on Russia’s oil trade were enforced – have been pushing Indian fuel demand and crude imports higher in recent weeks.

For example, India is estimated to have boosted its imports of Russian crude to a nine-month high in April, per data Reuters has obtained from industry and shipping sources.

Moreover, India’s crude oil demand has been growing this year despite consistently higher prices, suggesting that it is more resilient to price rises than some expected. 

Tyler Durden
Sat, 06/01/2024 – 18:40

Global Cocoa Shortage Much Worse Than Previously Forecasted As Prices Surge

Global Cocoa Shortage Much Worse Than Previously Forecasted As Prices Surge

The International Cocoa Organization has admitted that the global cocoa shortage will be significantly larger than previously forecasted. Cocoa prices in New York have rebounded in recent weeks, inching above the $9,330 per ton mark to close the week. 

First reported by Bloomberg, ICCO forecasted demand will exceed production by 439,000 tons, driven mainly by higher cocoa grinding in consuming countries. This is the second estimate for the current October-September year and is much larger than the February forecast for a deficit of 374,000 tons. 

“Currently available data reveal that cocoa grinding activities have so far been unrelenting in importing countries despite the record cocoa price rallies,” the ICCO, adding, “As the 2023-24 season progresses, it is certain the season will end in a higher deficit than previously expected.”

After the ‘great cocoa’ run-up in New York in the first 3.5 months of the year, through the first half of April, from $4,000 a ton to over $12,000 (a record high), prices crashed into May, down 44%. But in the last nine trading sessions, prices have surged to $9,330, or about 39%. 

The ICCO has increased its estimate for global cocoa grindings to 4.86 million tons, up from the initial forecast of 4.78 million tons, and increased its production projection by 12,000 tons to 4.46 million tons.

The revised forecast has likely captured the attention of Andurand Capital Management’s Pierre Andurand, who has been bullish on cocoa prices this year. 

Earlier this month, Andurand joined Bloomberg’s Odd Lots hosts Tracy Alloway and Joe Weisenthal to discuss the cocoa trade. 

Weisenthal asked the hedge fund manager: 

So what did your analyst see? Or how was your analyst able to see something in the supply and demand situation that he felt, and you felt, was not being identified by the analysts who cover this closely?

Andurand responded:

I think it’s mainly an understanding of how much prices have to move to balance the market. You know, sometimes people can trade that market for like 20 years. They’ve been used to a range of prices and they believe, okay, the top of the range is the high price for example.

But they don’t really ask themselves what makes that price, right?. And sometimes taking a step back can help. I mean what makes the price is mainly the fact that in the past you would have the supply response if prices were going up. But if now you don’t get the supply response, or the supply response takes four or five years, then you need to have a demand response.

And a lot of people look at prices in nominal terms. So you hear people saying ‘Oh, we are at all time high prices in cocoa, but that’s because they look at prices in nominal terms. [The] previous high in 1977 was $5,500 something dollars a ton of 1977 dollars, which is equivalent to $28,000 a ton of today’s dollars.

So we are still very far from previous highs. And so you have to look at a bit more history and understand in the past how prices reacted to a shortage, how long it took to recover the product shortage to actually solve itself. And what’s different today.

So there’s a ratio that we look at that most people look at, it’s actually the inventory to grindings ratio. So it’s a measure of inventory to demand, what we call grinding is basically industrial companies that take the cocoa beans and they want to make chocolate with it. So it’s a process and some of them make the end product chocolate directly. Some of them sell back the product to other chocolate makers.

And so basically a typical grinder would take cocoa beans and make cocoa butter and powder with it. And the prices of both those elements also went up even more than cocoa beans, which means that actually we probably had some destocking everywhere in the chain.

So it looks like demand, when we look at the chocolate makers, the end demand for chocolate didn’t go down at all, it looks to be flat on the year. Grindings look to be down three, three and half percent this year, despite the fact that the end demand is the same in volume, which means that they’ve been destocking cocoa beans actually.

And so we had destocking everywhere — at the end chocolate level, at the cocoa beans, at the cocoa butter and cocoa powder level. So we had this destocking everywhere on the chain and now we have the largest deficit ever on top of two previous years of deficit. And it looks like next year we will have a deficit.

So we’re in a situation where we might actually run out of inventories completely. I mean this year we think we will end up with an inventory to grinding ratio — so inventory at the end of the season — of 21%. For the last 10 years we’ve been between 35% and 40% roughly. At the previous peak in 1977 we were at 19% and that’s what drove us to $28,000 a ton, of todays’s dollars.

If we have another deficit next year, then we might go down to 13%. So I don’t think it’s actually possible. That’s when you really have real shortage of cocoa beans, you can’t get it and that’s when the price can really explode. And so understanding that you have to slow down demand and we know that demand can’t really be slowed.

So that’s when you can have an explosion [in price]. And remember that these commodity futures, you need to have, they’re actually physically settled. So if somebody wants to take delivery, they have to converge with the price of the physical. If you have no physical, somebody wants to take delivery, the price can go anywhere.

So it’s a dangerous commodity too short, right? If you have no physical against it. And actually sometimes we read news that the funds have been pushing cocoa prices. It’s actually completely untrue because the funds have been selling since February. They actually went from a length of 175,000 lots, so that’s 1.75 million tons of cocoa lengths, I think it was around like September last year in average, or a bit earlier, to 28,000 lots to 280,000 tons at the moment.

So they sold more than 80% of their length actually. And the people who’ve been buying the futures from the funds, it’s producers because they’re producing a lot less than they expected.

So what has been happening in the cocoa market is that you had a reduction of what we call the open interest, where both the longs would use their length and the shorts would use their shorts. And then we get into a market where you have less liquidity because you have less exposure, you have less longs and less shorts, and then the volatility increases.

So in the past when people were comfortable being, let’s say, having a 100 lots position now because it moves more than 10 times more than in the past, we’re going to have like a 10 lots position, right? So the market became more — due to the fact that we had a massive move and we have a massive deficit, so everybody’s reducing their positions and because of the increased volatility, we have less activity. And that’s what makes the point more volatile as well.

Andurand reaffirmed his $20,000 price target for later this year or next year… 

Tyler Durden
Sat, 06/01/2024 – 18:05

What A China-Taiwan Conflict Could Mean For Semiconductors, Gold

What A China-Taiwan Conflict Could Mean For Semiconductors, Gold

Via SchiffGold.com,

American-made weapons will soon be bound for Taiwan, American lawmakers are telling Taiwanese President Lai Ching-te, sending shockwaves of uncertainty through electronics and metals markets this week.

In a pointed “celebration” of Lai’s recent inauguration, Chinese military aircraft and warships have been conducting large-scale drills around the island. China considers Taiwan a strayed member of its territory and hasn’t ruled out the use of force to assert its claim.

“China will surely be reunified,” Chinese President Xi Jinping said in his New Year’s address. “Compatriots on both sides of the Taiwan Strait should be bound by a common sense of purpose and share in the glory of the rejuvenation of the Chinese nation.”

Michael McCaul, U.S. House Foreign Affairs Chairman, told Fox that the recent Chinese demonstrations are the most “provocative” yet. If China attacked Taiwan, McCaul predicted during his visit to the region, “it would make Iran shooting into Israel look like child’s play.”

“I think right now, we will probably lose,” he said.

One likely victim of such a conflict would be Taiwan’s semiconductor industry, which holds about 70% of the world market share. Total industry value is expected to set a record this year at $630 billion—but that could change if China invades Taiwan and, as McCaul warns, “the island doesn’t have the capacity to defend itself” or its industry.

“Everybody that has phones, cars—we have advanced weapons systems—everything’s dependent on semiconductors and this island, over time, because we’ve offshored [manufacturing],” McCaul told Fox News Digital. “And the shutdown of what’s happening [in Taiwan], semiconductors, would really shut down the world.”

Changes in the market for semiconductors mean changes in the market for many base metals, including silicon, germanium, and gallium, all of which are critical components for semiconductor manufacturing. Gold is also a key component of the production process because of its anti-tarnishing properties.

With a semiconductor shortage could come other electronics shortages, squeezing markets for everything from refrigerators to cell phones to electric vehicles. There’s precedent for such a shakeup, which occurred during the semiconductor shortage of the COVID-19 pandemic—and back then, the economic pandemonium didn’t stop short at consumer electronics.

“The recent semiconductor shortage isn’t some far-off issue—it affects everyday citizens around the globe,” the Council on Foreign Regulations reported last year. “Supply-chain challenges can yield price hikes for consumers and lost jobs for manufacturers. Companies laid off thousands of workers [during the COVID shortage] because the United States lacked chips.”

Such a drop in semiconductor production might initially appear to signal a decrease in demand for component metals, like gold. That seems to be the market’s immediate intuition, as shown by mildly ebbing gold prices following the Chinese drills—but a major complicating factor is quickly becoming apparent. China, already one of the world’s largest gold consumers, is busy buying up the precious metal at record rates. The country’s aggressions toward Taiwan will likely continue to drive precious metal prices upward, signaling a second precious metals boom when coupled with the rising market uncertainty and inflation that inevitably follow conflict.

“China is unquestionably driving the price of gold,” Ross Norman, chief executive of MetalsDaily.com, told the New York Times. “The flow of gold to China has gone from solid to an absolute torrent.”

Some experts suggest the move to amass precious metal stores could signal preparation for larger Chinese military involvement in Taiwan and increasing avoidance of ties with the U.S. dollar, which may be sanctioned in response to Chinese aggression. In short: China is betting on gold, not the dollar.

“There is absolutely no question that the timing and the sustained nature of [China’s gold] purchases are all part of a lesson that [the Chinese] have drawn from the Ukraine war,” Jonathan Eyal, associate director of the UK’s Royal United Services Institute, told the Telegraph. “The relentless purchases and the sheer quantity are clear signs that this is a political project which is prioritized by the leadership in Beijing because of what they see is a looming confrontation with the United States.”

“If [China] get[s] much closer to bullying Taiwan and countries start to move their investments out of China, [the gold reserves] will give them a bit of padding to be able to ride through some of the difficulties,” added Sir Iain Duncan Smith, co-chair of the UK Interparliamentary Alliance on China.

Meanwhile, the President has signed an aid package with $8 billion earmarked for Taiwan and the surrounding region, a move that aggravated US-China relations and will encourage economically painful sanctions on both sides. Such spending could also pull the trigger on domestic inflation, resulting in the continued weakening of the U.S. dollar even as the Chinese economy is strengthened by its gold reserves.

This type of monetary policy is why some economists, including Danial Lacalle of the IE Business School in Madrid, are sounding alarm bells at governmental inflation employed as a “policy, not a coincidence.” In this environment, Lacalle warns, it’s a bad idea to bet on inflated currency when choosing investments.

“Staying in cash is dangerous; accumulating government bonds is reckless; but rejecting gold is denying the reality of money,” Lacalle said.

Tyler Durden
Sat, 06/01/2024 – 17:30

Watch: Hezbollah Shoots Down Large Israeli Drone In Expanded Fighting

Watch: Hezbollah Shoots Down Large Israeli Drone In Expanded Fighting

Friday saw intensifying fighting on the Israel-Lebanon border as Hezbollah launched dozens of rockets in an expanded assault on northern Israel, some of which were sent to areas never hit before since the conflict started last year.

On Saturday morning the Lebanese paramilitary group which is allied with Iran issued a statement saying it launched “an air assault using explosive drones against… the Yiftah barracks, targeting the positions of enemy officers and soldiers.”

Hezbollah described this fresh operation as retaliation for an Israeli drone attack which wounded two Hezbollah members the day prior. Israel’s military had previously announced “two Hezbollah terrorists operating in the region of Majdal Selm were struck by an aircraft” on Friday.

But later in the day Saturday Hezbollah claimed a big win, having “shot down a Hermes 900 drone which was attacking our people and villages.”

We are now witnessing a drone war phase of sorts playing out. The large drone downing appears to be confirmed through widely circulating footage on Saturday:

“The enemy (Israel) intensified its attacks last night,” Lebanon’s National News Agency reported of heavy overnight fighting. This included “a series of drone strikes… which resulted in deaths, injuries and extensive damage” along the border. 

This isn’t the first time Hezbollah has claimed a Hermes drone downing. It reportedly happened in early April as well, and there have been claims of several others downed throughout more than six months of conflict.

According to Israeli media, “The Hermes 900 is Elbit’s largest drone and has been sold to the Israeli Air Force, Brazil, Colombia, Mexico, and according to foreign reports, Azerbaijan.”

“The UAV is a relatively large and expensive drone capable of staying in the air for approximately 30 straight hours,” the report noted. Each Hermes drone is worth around eight to ten million dollars and made in Israel.

Meanwhile significant damage has been revealed at the 769th Brigade headquarters of the Israeli army in the Kiryat Shmona barracks…

Tyler Durden
Sat, 06/01/2024 – 15:45

Bubble Symmetry: Could The NASDAQ Drop 60% And Round-Trip To 2,500?

Bubble Symmetry: Could The NASDAQ Drop 60% And Round-Trip To 2,500?

Authored by Charles Hugh Smith via OfTwoMinds blog,

The prospect of a 60% or 80% decline in the NASDAQ index is only horrifying if we stay invested in the index all the way down.

Speculative bubbles are interesting because they’re never bubbles in real time; they’re only recognized as bubbles after they’ve popped, as we sort through the wreckage of the aftermath. Speculative bubbles are equally interesting for their uncanny display of bubble symmetry and scale invariance, two traits of manias.

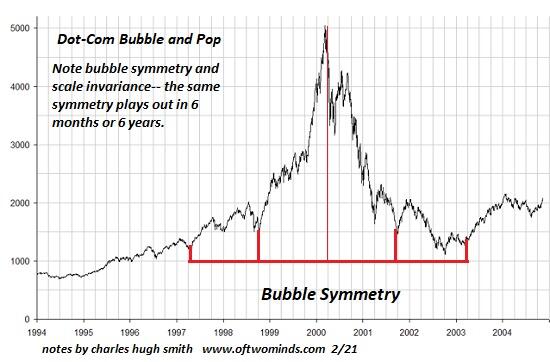
In bubble symmetry, the decline phase is the mirror-image of the manic boost phase, in both time and amplitude. For example, the NASDAQ’s dot-com bubble rose from around 1,100 in early 1997 to a peak above 5,000 in early March 2000, a rise of about 3,900 over three years.

The bubble-pop phase lasted about three years and covered a decline / round-trip back to around 1,100: a decline of about 77%. The first chart below shows the remarkable symmetry of the bubble’s ascent and collapse.

Scale invariance refers to the similarity of a 600 point bubble that arises in six months to a 6,000 point bubble that arises over 6 years: if we add a zero to the number of months (time) and the number of points (amplitude), the bubbles retain the same characteristics. Put another way, a speculative mania that lasts a week shares the same characteristics of a speculative mania that lasts a month and one that lasts a year.

Pulling back to look at the NASDAQ index from 1990 to the present, what’s striking is the modest scale of the dot-com bubble of 1997-2002. What looked like an almost unimaginably lofty peak in 2000 (5,048) now looks like a pipsqueak bubble compared to the current heights (17,032).

Also noteworthy is the time it took to reclaim the heights of the dot-com bubble. Almost 17 years passed before the index definitively topped its 2000 high of 5,048. But if we measure the purchasing power of $5,000 in 2000 and adjust for officially measured inflation from 2000 to 2018, the index had to top $7,360 to match the 2000 peak, a number it did not reach until early 2018–18 years after the peak.

Given that the index crashed back to 6,879 in March of 2020, it can be argued that the index didn’t definitively surpass the 2000 high until 2020, fully 20 years after the dot-com peak. That is a soberingly lengthy passage of time to recover the full value of cash invested at the very top of the bubble.

Now let’s project bubble symmetry on the current NASDAQ bubble. This is a FRED (St. Louis Federal Reserve) chart which doesn’t use nominal price but sets the value of the index on 2/5/1971 at 100. The basics of time duration and amplitude are essentially identical with the nominal price chart.

If the index follows the symmetry of the 2000 bubble, then we can anticipate a 60% decline by 2028 to the 2020 lows around 6,800. The full retracement of the bubble would occur by about 2032-33 with a decline to the base of the bubble, around 2,500–an 85% drop from the 2024 peak.

I’ve laid out a classic A-B-C-D pattern with a proposed narrative that tracks 1) systemic inflation and 2) the decay to zero of the Federal Reserve and Treasury’s ability to “save” the stock market with financial alchemy. I’ve made the case for sustained, systemic inflation here many times, and also made the case for diminishing returns on pumping newly issued currency into the financial system to artificially boost equities.

The prospect of a 60% or 80% decline in the NASDAQ index is only horrifying if we stay invested in the index all the way down. Those with no stake in the index will be mere observers. Since 93% of all stock ownership is concentrated in the top 10% households in the U.S., and the bottom 90% have relatively little invested directly or indirectly via pension funds and retirement funds, the full weight of this decline–which history suggests is inevitable–will fall on whomever believes such a decline is impossible and a turnaround is, well, just around the corner.

Those of us who lived through the 2000 bubbles experienced a trial run of all the emotions and market actions to come: the euphoria of easy, ever grander profits, the anxiety of the first decline, and then the swings from relief to fear as sharp recovery spikes wiped out those betting on a further decline before dropping to new lows.

If inflation is now systemic, then we can anticipate the hope-anxiety cycle will follow the “inflation is tamed / inflation is roaring back untamed” narrative. So the current peak of the happy narrative priced to perfection collapses when inflation doesn’t vanish, then recovers sharply when inflation temporarily recedes, and the the next leg down occurs when the next wave of inflation soars to new debilitating heights.

There are of course counter-arguments: stocks rise in inflationary eras, etc. There were counter-arguments in 2000 as well; many saw the first decline as a “buy the dip” opportunity, after $80 dot-com stocks fell to $40. That they would subsequently fall to $4 or $2 was not anticipated by the herd. That is of course the way bubbles pop: in fits and starts, always offering hope that the dreadful destruction of “wealth” will reverse.

We don’t control macro-dynamics or markets’ response to these dynamics. We can only choose to be observers or participants, that is, choose our exposure to risk.

*  *  *

Become a $3/month patron of my work via patreon.com. Subscribe to my Substack for free

Tyler Durden
Sat, 06/01/2024 – 15:10

General Dynamics’ New 155-Millimeter Shell Factory Opens As War Cycle Kicks Into Higher Gear

General Dynamics’ New 155-Millimeter Shell Factory Opens As War Cycle Kicks Into Higher Gear

General Dynamics’ new 155-millimeter artillery shell factory in Mesquite, Texas, is set to produce 30,000 shells per month, according to a New York Times report. This will provide crucial support to the Ukrainian Armed Forces on the first and second lines and bring the US Army closer to its 100,000 shell target goal by 2025. However, this goal remains far behind Russia’s current 155mm shell production capacity of 250,000 rounds per month.

On Wednesday, National Security Council spokesperson John Kirby told reporters the new Mesquite shell factory “will significantly increase our country’s ability to manufacture parts that are used to produce artillery ammunition.”

Kirby said construction at the Mesquite factory began last year with funds allotted by the $95 billion security supplemental passed by Congress last month “to stand up new production lines as part of a national effort to significantly increase the number of artillery shells that we produce every month.”

At full capacity, the factory will produce 30,000 155mm shells a month. The latest data from NATO’s secretary-general showed that Ukraine fires between 4,000 and 7,000 shells per day. The West is currently depleting 155mm stockpiles, along with other crucial weapons. 

Shell factories in Scranton and Wilkes-Barre, Pennsylvania, currently produce about 36,000 155mm shells per month. Once the Mesquite plant reaches its full capacity of 30,000 shells per month, the US Army will be closer to achieving its goal of 100,000 shells per month by 2025. 

The Biden administration’s disastrous foreign policies have resulted in a chaotic world. From Eastern Europe to the Middle East, these conflicts, some of which are broadening, have resulted in the US dangerously depleting weapon and ammunition stockpiles.

To correct this, the US and other Western nations have been ramping up defense spending as the war cycle kicks into a higher gear. This has sparked a bull market in defense stocks, as there is no end in sight to conflicts resolving this year. 

Tyler Durden
Sat, 06/01/2024 – 14:35

Why Consumers Are Angry About The Economy In Five Pictures

Why Consumers Are Angry About The Economy In Five Pictures

Authored by Miked Shedlock via MishTalk.com,

Today the BEA released April data on inflation-adjusted income and spending. Let’s discuss the charts.

Data from the BEA and BLS, chart by Mish

Personal Income and Wages Key Points

  • DPI stands for Disposable Person Income. Disposable means after taxes.
  • Real means inflation adjusted.
  • Income includes wages, dividends, rent and all sources of income.

Workers who don’t receive dividends or rental income view the world as shown by the red lines. Those who have no assets are renters.

Index of Hourly Wages and Multiple Jobholders

One reason Disposable Personal Income is up: People need to work multiple jobs just to make ends meet.

This is also reflected in the blue line in the lead chart.

Personal Income Four Ways

Personal Current Transfer Receipts

The above chart introduces Personal Current Transfer Receipts (PCTR). PCTR is income for which no goods were produced and no work performed.

PCTR includes Medicare, Medicaid, disability payments, food stamps, rent assistance, and Social Security.

PCTR is included in Disposable Income in all of the above charts.

The green line in the above chart shows Real DPI minus PCTR. Please compare the green line to the red line.

PCTR as a Percentage of Real Personal Income

Hoot of the Day

One of the reasons people are angry is the inflation-causing free money ran out. People increasingly have to work multiple jobs to make ends meet.

CPI Up 0.3 Percent With Rent Still Rising Steeply

Rent rose another 0.4 percent in April. Food and beverages were flat with food at home declining but food away from home rising.

CPI data from the BLS, chart by Mish

Key CPI Points

  • Rent is up at least 0.4 percent for 32 consecutive months.
  • The CPI weighs rent much higher than PCE. That’s why the CPI is up 3.6 percent from a year ago and PCE only 2.7 percent.
  • All of the preceding income charts would look much worse if adjusted by the CPI rather than the PCE price index.

Please read those points again. The first three income charts are worse than they look if adjusted by the CPI.

For discussion and additional CPI charts, please see CPI Up 0.3 Percent With Rent Still Rising Steeply

Rent of primary residence, the cost that best equates to the rent people pay, jumped another 0.4 percent in April. Rent of primary residence has gone up at least 0.4 percent for 32 consecutive months! 

Home Prices Hit New Record High, Don’t Worry, It’s Not Inflation

The Case-Shiller national home price index hit a new high in February. Economists don’t count this as inflation.

This is a bonus image.

Case-Shiller national and 10-city indexes via St. Louis Fed, OER, CPI, and Rent from the BLS

On May 2, I sarcastically commented Home Prices Hit New Record High, Don’t Worry, It’s Not Inflation

That chart is one month stale now. We hit another new record in March.

The Fed’s Preferred Inflation Measure, PCE, Shows No Further Progress

More weakening: Real (inflation-adjusted) Income and spending was negative in April. The PCE price index remained flat at 0.3 percent for the month and 2.7 percent for the year.

Chart from the BEA, annotations by Mish

Earlier today I noted The Fed’s Preferred Inflation Measure, PCE, Shows No Further Progress

This post contains four charts related to personal income and outlays discussed above.

Anger Synopsis

Consumers are angry, and it’s reflected in the polls. I have been discussing the reasons for angry consumers all year.

But Biden and most economists still don’t get it. They think the economy is doing well. Tell that to renters looking to buy a home, stuck with rent going up month after month.

People Who Rent Will Decide the 2024 Presidential Election

On April 20, I wrote People Who Rent Will Decide the 2024 Presidential Election

Who Are the Renters?

The answer is younger voters and blacks.

The Apartment List 2023 Millennial Homeownership Report shows Millennial homeownership seriously lags other generations.

Generation Z homeownership is dramatically lower still.

And according to the National Association of Realtors, the homeownership rate among Black Americans is 44 percent whereas for White Americans it’s 72.7 percent.

That’s the largest Black-White homeownership rate gap in a decade.

Will the Conviction of Trump Matter?

I doubt it. People will vote with their pocketbook.

For discussion of the political side, please see Trump Found Guilty – a Travesty of Justice for America

If you are not interested in politics, please ignore that link and focus on the rest of this post.

Returning to the economy, inflation will finally come down when rent abates but there will be a price. The price is recession.

I expect a recession this year. It will not surprise me at all if a recession started in 2024 Q2, perhaps April.

Tyler Durden
Sat, 06/01/2024 – 14:00

Netanyahu Quickly Slams Door On Biden’s Major Gaza Ceasefire Plan: “Non-Starter”

Netanyahu Quickly Slams Door On Biden’s Major Gaza Ceasefire Plan: “Non-Starter”

Prime Minister Benjamin Netanyahu slammed the door shut on President Biden’s new appeal urging both Israel and Hamas to accept the new ceasefire plan set before both sides. As we detailed earlier, Biden’s Friday afternoon speech was mostly about pressuring Israel to end the war. The message was clear at a moment the Democratic president faces dissent and pushback from his base headed into a tight November election: “I urge Israel to stand behind this deal, despite whatever pressure comes,” he emphasized.

But coming a mere hours later, Netanyahu has made it clear there will be no permanent ceasefire in Gaza until Hamas is completely eradicated. He went so far as to say the current deal being pushed hard by the White House is a “non-starter”.

“Israel’s conditions for ending the war have not changed: The destruction of Hamas military and governing capabilities, the freeing of all hostages and ensuring that Gaza no longer poses a threat to Israel,” Netanyahu said.

“Israel will continue to insist these conditions are met before a permanent ceasefire is put in place. The notion that Israel will agree to a permanent ceasefire before these conditions are fulfilled is a non-starter,” he added.

Remarking on the significance, Times of Israel observed that “His comments, in a rare statement published on the Sabbath and only in English, came after United States President Joe Biden announced Friday that Israel had proposed a three-phase deal for a ceasefire in Gaza in exchange for Hamas releasing hostages, told the terror group to accept it and urged the Israeli government to stand behind it.”

Much of Biden’s speech had appeared geared toward convincing Netanyahu and the Israeli public to not drift into the more hardline positions of hawkish officials like Itamar Ben-Gvir and Bezalel Smotrich. Biden had even claimed Hamas is no longer capable of carrying out an Oct.7-style terror attack again.

He had said in the major televised address: “I know there are those in Israel who will not agree with this plan and will call for the war to continue indefinitely. Some are even in the government coalition. They’ve made it clear they want to occupy Gaza, they want to keep fighting for years, the hostages are not a priority for them.”

Well… this grand White House ‘pressure’ initiative didn’t even last a full 24-hours…

This has also been a message of the ongoing anti-Netanyahu protests in Tel Aviv led by the hostage victims’ families. But Netanyahu’s office had made it clear right away that Israel’s military policy would not be dictated from Washington (despite the billions in annual US defense aid given). Israel media has detailed

A US official later said the Israeli proposal was a highly detailed three-to-four-page document. It was apparently approved by the war cabinet — compromising Netanyahu, Defense Minister Yoav Gallant and minister Benny Gantz — but presumably not yet presented to the wider security cabinet, of which far-fight ministers Itamar Ben Gvir and Bezalel Smotrich are members, and on whose support Netanyahu depends for his coalition’s majority.

Immediately after the speech,  Netanyahu — whom Biden avoided naming — released an initial statement saying that “The Israeli government is united in the desire to return our hostages as soon as possible and is working to achieve this goal.”

Netanyahu’s “non-starter” comment is a slap in the face to the White House, which has made largely empty threats about reigning in Israeli policy in Gaza. 

Biden now finds himself between a rock and a hard place in an election year and his Gaza policies are deeply unpopular among many Democrats. The intractable conflict and his handling of it has threatened to sink his chances going up against Trump as both campaigns kick into high gear. Israel’s military has in the last days expanded its Rafah ground operations, and has now moved into most parts of the southern city.

Tyler Durden
Sat, 06/01/2024 – 13:25

Three Quarters Of US Voters Say Country Is “Out Of Control” Under Biden; New Poll Finds

Three Quarters Of US Voters Say Country Is “Out Of Control” Under Biden; New Poll Finds

Authored by Steve Watson via Modernity.news,

A whopping three quarters of voters say the US is “out of control” and on the “wrong track” under the Biden administration, according to a poll.

A Hart Research/Public Opinion Strategies/NBC News survey reveals that 73 percent of voters overall hold the opinion, making it the highest on record under any president since the tracking began.

The last time the number was this high, it was under George W. Bush in 2008, with 70 percent. The Obama administration had 65 percent expressing the same opinion.

The poll also found, like most others, that Trump is leading Biden in six of the seven swing states, including Wisconsin, where some other polls have recorded Biden having a narrow lead.

The survey also discovered that non-white voters are turning away from Democrats, and to the Republican Party. In the past four years, non-white voters have shifted approximately 40 points in favour of the GOP.

Republican pollster Bill McInturff highlighted that 41 percent of registered voters now identify as Republicans, and 40 percent as Democrats. By comparison, in 2016, Democrats had a seven point advantage.

As we highlighted yesterday, Democratic operatives have claimed the Party is in full blown “freak out” mode over Biden’s decline.

A majority of Democrat voters still want Biden replaced with another candidate just months before the election.

On Wednesday, Biden failed to fill a high school gymnasium in Philadelphia, with the school kids themselves filling up the empty space. 

*  *  *

Your support is crucial in helping us defeat mass censorship. Please consider donating via Locals or check out our unique merch. Follow us on X @ModernityNews.

Tyler Durden
Sat, 06/01/2024 – 12:50

Countdown To Boeing’s Starliner Spacecraft Launch “Has Been Stopped”

Countdown To Boeing’s Starliner Spacecraft Launch “Has Been Stopped”

Update (1245ET):

The Boeing-Lockheed Martin joint venture United Launch Alliance wrote on X, “Hold. The countdown has been stopped. Safing of the Atlas V, Starliner and launch pad systems is underway.” 

The launch of Boeing’s Starliner spacecraft has been delayed. Ground controllers called a hold with 3 minutes and 50 seconds left in the countdown. No reason for the delay was immediately given. There is another launch opportunity Sunday,” Washington Post’s Christian Davenport wrote in a blog update. 

“How can Space X launch 5 of these per day yet NASA and Boeing can’t launch even one in a month??” one X user asked. 

“Need to get some SpaceX personnel at ULA asap,” one X user said. 

Sigh, Boeing…

*    *    * 

NASA and Boeing are preparing to launch the much-delayed crewed flight of CST-100 Starliner at 1225 ET from NASA’s Kennedy Space Center in Florida, atop an Atlas V rocket from the Boeing-Lockheed Martin joint venture United Launch Alliance. 

Weather conditions are 90% favorable for launch, Mark Burger, the launch weather officer at Cape Canaveral Space Force Station, told CNN

The Saturday launch comes after the first May 6 launch was halted just two hours before launch time due to a faulty pressure valve on the Atlas rocket. Days later, a helium leak and another issue were detected in Starliner’s propulsion system. 

“This is a test flight, we know we’re going to learn some things,” Boeing’s commercial crew vice president Mark Nappi told reporters on Friday.

The CST-100 Starliner will ferry two astronauts, Sunita “Suni” Williams and Barry “Butch” Wilmore, to the International Space Station. They are expected to reach the ISS around midday Sunday and stay for about a week.  

In 2014, NASA awarded Boeing $4.2 billion and Elon Musk’s SpaceX $2.6 billion in contracts to create vehicles to ferry astronauts to space. 

Since then, Elon Musk’s SpaceX has launched nine crewed missions to the ISS since 2020, while Boeing’s Starliner, plagued with glitches and failures and years behind schedule, has yet to lift off the ground with astronauts.

Watch: Launch Event Live Here:

According to space research firm BryceTech, SpaceX was the global leader in space launches in the first quarter, totaling 31, with China in second at 9 and Russia in third with 5.

“SpaceX launched about 429,125 kg of spacecraft upmass in Q1, followed by CASC with about 29,426 kg,” the report said

Boeing, along with the rest of the US legacy defense companies, and entire countries – like superpowers, such as China and Russia – are quickly falling behind Musk’s SpaceX.

Tyler Durden
Sat, 06/01/2024 – 12:43