56.1 F
Chicago
Saturday, October 3, 2026
Home Blog Page 30

‘Pausing’ Intensifies: OpenAI Unleashes Latest Model Minutes After Dario Dumps Magnum Opus

0
‘Pausing’ Intensifies: OpenAI Unleashes Latest Model Minutes After Dario Dumps Magnum Opus

Update (1417ET): Well, well, well…

Anthropic’s new Opus launch went up around lunchtime in New York, and by early afternoon OpenAI had rolled out GPT-6 Sol and GPT-6 Luna, halving prices yet again.

GPT-6 Sol now costs $2 per million input tokens and $10 per million output, half the $4/$20 promo rate Anthropic matched earlier today. GPT-6 Luna goes for a dime in and 50 cents out, pricing that looks built to fight the open-weight models eating token share. OpenAI says cached input gets a 90% discount, which puts Sol’s cache reads at $0.20, the same rate we call Anthropic’s “real knife” below. GPT-6 Astra stays on top at $10/$50. The upshot: the $4/$20 price point didn’t survive the afternoon, and Opus 5.5 now costs twice as much as OpenAI’s workhorse on input and output.

OpenAI’s charts, naturally, pit Sol against last-gen Claude. On AutomationBench, it touts Sol’s 33.2% at 27 cents a task against Opus 5’s 26.9% at 11 times the cost. Opus 5.5, which Anthropic says scored 40.0% on the same test, isn’t on the chart, which was out of date the moment it posted. OpenAI also slipped in a dig at Anthropic’s safeguards, noting in a footnote that Fable 5.1 fell back to Opus 5 on roughly 40% of tasks (see “The Fine Print” below). Score: Anthropic. Sticker: OpenAI. Anthropic’s rebuttal is that Opus 5.5 needs fewer tokens to finish the job.

GPT-6 Sol had been rumored for days, with leakers pointing to Tuesday at a price of $2.50/$15 that turned out to be too high, and some reports claimed Anthropic hurried Opus 5.5 out the door to beat it. Either way, ten days after both CEOs agreed the industry should “pace the frontier,” the two labs spent Tuesday trampling each other’s headlines.

Pacing, it turns out, is a team sport.

* * *

Anthropic on Tuesday unveiled Claude Opus 5.5, just 10 days after CEO Dario Amodei called for “pacing the frontier” of AI development.

The pitch: Fable-class brains at a steep discount. Anthropic says the new model “performs at the level of Claude Fable 5.1 for most tasks” and costs 40% less to run than Opus 5, which launched all of 60 days ago. List-price cuts run from 20% on input and output tokens to 60% on cache reads, the line item Anthropic says accounts for most of the bill in agentic and coding work. For context, Fable 5.1 lists at $10/$50 per million tokens, or 2.5 times the new Opus price.

The launch was Silicon Valley’s worst-kept secret: the $4/$20 pricing and a Tuesday launch date leaked days early, and Polymarket had priced better-than-80% odds of a Sept. 22 release.

Anthropic says Opus 5.5 leads in agentic coding, computer use and knowledge work, scoring 66.4% on Terminal-Bench 4.0 against 57.9% for OpenAI’s GPT-6 Astra, and 55.8% for Fable 5.1, while generating output more than 30% faster than Opus 5. Sonnet 5.5 and Haiku 5.5 follow within weeks, and subscribers get higher five-hour limits on Pro, Max and Team plans (a 20% bump, per The New Stack) plus a rate-limit reset they can bank for later. On the API, the model is cheaper everywhere: $4 per million input tokens and $20 per million output, $5 for cache writes and $0.20 for cache reads, with a fast mode that runs up to 2.5x quicker for $8/$40.

20%, 40% Or 60%?

What percentage are we actually saving here? All three, depending on the situation. Input and output tokens are 20% cheaper, cache reads are 60% cheaper, and the 40% is Anthropic’s estimate of how much less a typical task costs all-in once Opus 5.5’s leaner token use is factored in. The more of a bill that goes to cache reads, the closer the rate cut gets to the 60% ceiling, which is why agent-heavy users come out furthest ahead: a workload split evenly between cache reads and everything else gets a 40% rate cut before counting any token savings.

Early testers say the efficiency is real, at least on their own workloads: Box said Opus 5.5 got through its evaluations on roughly a third of the tokens Opus 5 needed, and trading firm Optiver said its agentic coding costs fell 40% to 50%.

Anthropic also took direct aim at OpenAI. Its own scorecard has default-effort Opus 5.5 topping Astra’s best FrontierCode result for about a fifth of the per-task cost, drawing even with Astra on Terminal-Bench 4.0 at default effort for roughly 40% of the cost, and clearing Sol by 11 points on CursorBench at about a third of the price.

The Race To The Bottom

From 10,000 feet, Opus 5.5 is the latest shot in a frontier price war that is turning “flagship AI” into a commodity with a falling price tag thanks to super efficient, open-weight models out of China.

Here’s a fun metric: the timeline as measured in dollars per million input/output tokens:

  • August 2025: Claude Opus 4.1 lists at $15/$75.
  • November 2025: Opus 4.5 resets the tier to $5/$25.
  • July 9, 2026: OpenAI’s GPT-5.6 Sol debuts at $5/$30.
  • July 24: Opus 5 holds at $5/$25, half the price of Fable 5.
  • Aug. 21: OpenAI knocks Sol down to a “promotional” $4/$20 (heh), guaranteed through at least Nov. 21, undercutting Opus 5 on both input and output.
  • Sept. 1-3: Fable 5.1 and GPT-6 Astra anchor the top end at $10/$50.
  • Sept. 22: Opus 5.5 matches Sol’s promo price to the penny, and the real knife is in the cache line: $0.20, or half of Sol’s $0.40 cached-input rate.

That’s a 73% cut in Opus-tier list prices in just over a year.

OpenAI isn’t the only one leaning on prices. Open-weight models (think DeepSeek, Moonshot AI and Z.ai) carried 56% of the token traffic on Vercel’s AI Gateway in August, versus 7% in December, yet accounted for only 14% of estimated spend. By our math, the average closed-model token cost nearly eight times an open-weight one. Average per-token pricing on the gateway dropped 23.2% in August, its third monthly decline in a row. Over at OpenRouter, open-weight models, mostly Chinese, made up 60% of US token usage in August.

So how does Anthropic still capture 64% of the money spent through Vercel’s gateway? By undercutting itself before anyone else can. Fable 5’s slice of gateway spend shrank from 13.2% in July to 4.9% in August while the half-price Opus 5 jumped to 22.5%, keeping the revenue in-house even as customers traded down. Opus 5.5 runs the same play one rung lower: Fable 5.1-level work at 40% of Fable 5.1’s sticker.

It’s a Jevons bet: cut the unit price, sell vastly more units. So far it’s paying. Anthropic’s annualized revenue run rate topped $65 billion at the end of July, per Bloomberg, up from $9 billion at the end of 2025, and investors reportedly expect it to finish the year between $100 billion and $120 billion. With a confidential draft S-1 at the SEC since June 1, the question for would-be IPO buyers is how long volume can outrun deflation once every lab is running the same play.

About That “Pacing”…

On Sept. 12, Amodei published “We Must Pace the Frontier,” calling on the handful of frontier labs to ease off the capabilities accelerator together. Sam Altman publicly signed on, and Elon Musk chimed in that Amodei had it right. The world shook in fear, having collective nightmares of Skynet coming online at the hands of cold, calculating frontier models!

Dario Amodei, Sept. 12: “We must slow the pace at which we improve the capabilities of AI models.”

But then…

Anthropic, Sept. 22:

‘Pacing’ indeed.

The Fine Print (shit to know)

  • Your agent may be talking to a different model. Because Opus 5.5 rivals Anthropic’s top-end Mythos 5.1 in biology and cybersecurity, it ships with Fable 5.1-style safeguards: routine bug-fixing stays put, but most cybersecurity work gets handed to the older Opus 4.8. The New Stack warns that individual calls inside an agent workflow could quietly land on older, less capable models.
  • It knows when it’s being watched. Anthropic admits Opus 5.5 frequently seems to suspect it’s being tested, which muddies any read on how it behaves in the wild.
  • The moat gets a lock. Thinking can no longer be switched off, and a new anti-distillation safeguard blocks API customers from doctoring earlier context to fish out its reasoning. That’s Anthropic’s answer to fake-account extraction campaigns it describes as a national-security risk.
  • Not a clean sweep. Astra still wins AutomationBench (41.4% vs. 40.0%) and Terminal-Bench-Science (64.6% vs. 58.7%). Anthropic itself concedes benchmark margins have become a shakier guide, saying that in its own use Opus 5.5’s edge over Fable 5.1 is smaller than the numbers imply.

Your Move, Sam

Sol’s discounted rate is only locked in through at least Nov. 21, and Anthropic just matched it with a model it says beats Sol by double digits on CursorBench. OpenAI can cut again, make the promo permanent, or let Sol snap back to $5/$30 against a cheaper rival. Pick your poison.

Tyler Durden
Tue, 09/22/2026 – 21:55

A Septennial Analysis Of Pre-Collapse Macroeconomic Indicators

0
A Septennial Analysis Of Pre-Collapse Macroeconomic Indicators

Authored by Milan Adams via Preppgroup,

Walk through any downtown financial district in mid-September 2026 and you’ll see the same strange disconnect. Construction crews still raise glass towers. Restaurants at noon remain packed with expense-account lunches. Bespoke tailors on side streets measure suits for clients who haven’t yet noticed their foundations shifting.

Surface-level appearances suggest continuity, even prosperity. Yet beneath this maintained facade, data streams flowing from Treasury servers, credit bureaus, and trading floors tell a markedly different story – one of accumulating strain that policy statements cannot wish away.

By September 8, 2026, United States federal debt reached $40.13 trillion. That figure translates to roughly $119,784 owed by every man, woman, and child in the country, a burden that would have seemed absurd to discuss seriously even fifteen years ago. More immediately concerning than the nominal amount is the speed at which carrying costs are escalating. Through August of fiscal 2026, gross interest payments on public debt hit $1.267 trillion – a record pace that consumes resources otherwise available for infrastructure, education, or research.

Congressional Budget Office projections now show net interest consuming 13.95% of all federal outlays in FY2026, rising to 14.25% in FY2027 and approaching 15% by FY2028. Nearly fifteen cents of every dollar spent serves not current needs but past obligations. That reallocation, gradual enough to escape daily headlines, nonetheless represents a fundamental shift in how America deploys its collective resources.

Several interconnected developments, examined together, illuminate why September 2026 marks a particularly precarious moment:

  • Sovereign Debt Saturation: Federal obligations exceeding 120% of GDP, with interest costs creating self-reinforcing cycles where new borrowing pays old debt service

  • Household Financial Distress: Consumer debt at $18.19 trillion as of Q1 2026, with delinquency rates in multiple categories approaching levels last seen during the 2008 crisis

  • Commercial Real Estate Deterioration: Approximately $875 billion in mortgages maturing during 2026 against depressed occupancy and valuation fundamentals

  • Currency Instability Signals: Gold prices swinging violently between $4,360 and $5,589, indicating deep uncertainty about fiat stability

  • Emerging Market Fragility: Over 54 nations currently in or near debt distress per IMF assessments, raising contagion risks

How the Debt Trap Springs Shut

Federal fiscal dynamics in 2026 reveal mechanics that compound faster than political timelines can address. That $40.13 trillion figure becomes genuinely alarming when viewed through debt-sustainability analysis. Average interest rates on marketable national debt reached 3.475% by August 2026 – substantially above the near-zero rates that prevailed through much of the pandemic period.

With debt stocks exceeding annual output by over twenty percentage points, even modest rate increases generate exponential service requirements. CBO forecasts $16.2 trillion in net interest payments across the coming decade, climbing from $1.0 trillion in 2026 to $2.1 trillion by 2036. At those levels, debt service crowds out virtually all discretionary spending.

Compounding works insidiously. Maturing debt rolls over at higher rates. Treasury auctions must attract sufficient participation to refinance existing obligations plus fund new deficits. Bid-to-cover ratios for four-week bills stood at 2.97 in August 2026 – technically adequate, yet vulnerable to sentiment shifts. Foreign holdings have grown concentrated and potentially volatile; Russia substantially reduced Treasury exposure, while other nations diversify reserves away from dollar assets.

Fiscal year 2026 deficits will likely exceed $2.67 trillion according to Joint Economic Committee data released September 8. That imbalance isn’t temporary cyclicality but structural feature. Tax revenues, constrained by legislative gridlock and sectoral stagnation, fail to match expenditure growth driven by entitlements, defense commitments, and – ironically – debt service itself. Each year’s deficit adds to debt stock, which raises next year’s service costs, which widens future deficits.

Penn Wharton Budget Model estimates suggest U.S. federal debt cannot rationally exceed roughly 210% of GDP as an outer limit – a threshold that current healthcare cost growth could reach within two decades. Markets typically impose discipline well before theoretical limits. When confidence erodes sufficiently, crisis arrives suddenly.

Kitchen Tables Buckling Under Weight

Sovereign debt attracts political attention, yet household balance sheets show equally troubling patterns. Consumer debt reached $18.19 trillion in Q1 2026 according to Equifax data released May 28. That aggregate – encompassing credit cards, auto loans, student debt, and other obligations – masks severe distributional stresses threatening both individual welfare and aggregate demand.

Credit card delinquencies have risen to levels unseen since 2008-2009. Between Q3 2022 and Q1 2026, balances 90+ days delinquent jumped from 7.6% to 12.8%. Federal Reserve Bank of New York data from August 2026 shows these transition rates into serious delinquency remain elevated even as headline economic growth appears stable.

Student loans present particularly intractable challenges. Total outstanding: $1.66 trillion as of Q1 2026. Payment resumption following pandemic forbearance generated severe adjustment shocks. Delinquency rates hit 10.3% of balances 90+ days past due in Q1 2026, up from 9.6% in Q4 2025, with further deterioration expected as temporary relief expires. Unlike other debt categories, student loans cannot be discharged through bankruptcy, creating permanent drags on borrower capacity.

Auto loan delinquencies reached unprecedented highs per FRBNY data from May 2026. Behind these numbers lie structural conditions, not individual mismanagement: vehicle price inflation during 2021-2023, subsequent rate increases raising monthly payments, and wage growth failing to match cost-of-living adjustments.

Housing markets compound pressures. Mortgage rates near 6.57% in Spring 2026 – down from 2023 peaks but far above 3% rates many homeowners locked in during refinancing booms – created “rate lock-in” effects freezing turnover. Supply constraints maintain prices excluding first-time buyers. Joint Center for Housing Studies at Harvard data shows units affordable to households earning $75,000 or less dropped 60% from March 2019 to March 2026, creating generations of permanent renters or multi-generational households.

Consumer credit cycles enter dangerous phases when households exhaust pandemic-era savings and increasingly rely on credit to maintain consumption patterns. Rising delinquencies prompt lenders tightening standards, reducing availability precisely when households need it most. Such procyclical dynamics amplify downturns.

Empty Towers, Broken Loans

Commercial real estate illustrates delayed crisis dynamics perhaps better than any other sector. A $1.5 trillion “debt wall” approaches in 2026-2027 – loans originated during 2019-2021 low-rate environments now requiring refinancing at substantially higher costs. Approximately $875 billion in commercial and multifamily mortgages mature during 2026 alone. Borrowers face debt service coverage ratio trips, cash management challenges, and carve-out exposure threatening equity positions.

Office properties constitute epicenters. Hybrid work arrangements, initially viewed as temporary pandemic adaptations, proved structurally durable. Central business district occupancy remains 30-40% below pre-pandemic norms in many major markets, rendering obsolete vast Class B and C office inventories. Valuation compression has been severe; some metropolitan office markets saw price declines exceeding 50% from 2019 peaks.

Banking system exposure creates systemic vulnerabilities. Regional banks hold disproportionate commercial real estate loan shares relative to money center institutions, facing capital erosion as losses mount. By June 2026, nearly $37 billion in commercial real estate loans – 1.17% of all bank-held loans – were delinquent. While below 9% post-2008 levels, trajectories concern regulators and market participants.

Federal Reserve stress testing identifies commercial real estate concentration risk as primary regional banking vulnerability. Institutions with exposures exceeding 300% of risk-based capital face heightened scrutiny; several raised capital at distressed valuations or sought strategic alternatives. Metropolitan Bank’s failure in early 2026, costing FDIC Deposit Insurance Fund approximately $19.7 million, exemplifies these pressures.

More troubling than realized losses is valuation uncertainty. Transaction volumes collapsed – buyer-seller bid-ask spreads remain too wide for price discovery. Banks face “extend and pretend” incentives avoiding loss recognition. Such dynamics, familiar from Japan’s 1990s experience, transform acute crises into chronic stagnation as zombie assets clog balance sheets and impede credit creation.

Regional banks serve as primary small and medium enterprise credit intermediaries; their impairment threatens employment and investment far beyond real estate markets. 2023’s Silicon Valley Bank, Signature Bank, and First Republic failures previewed dynamics that could recur if commercial real estate losses accelerate.

Gold’s Warning, Dollar’s Contradictions

Monetary instability appears not merely in inflation statistics – August 2026’s 3.4% annual rate, improved from 2022 peaks yet above Federal Reserve targets – but in alternative store-of-value behavior. Gold prices reached record highs above $5,589 in early 2026, then corrected to approximately $4,360 by September, exhibiting volatility signaling deep uncertainty about fiat stability.

Such price action reveals investor ambivalence. Unprecedented gold rallies suggested profound dollar purchasing power and sovereign debt sustainability concerns. Corrections to $4,360 reflected profit-taking and temporary dollar strength, yet continued elevation well above norms indicates persistent non-fiat reserve demand. Central bank gold accumulation continues at rates unseen since Bretton Woods collapse.

Dollar positioning shows similar contradictions. Against major currency baskets, dollar indices show resilience, yet strength masks underlying fragility. Foreign Treasury holdings grew concentrated among allied nations, while strategic competitors systematically reduced exposure. Petrodollar systems underpinning dollar hegemony since the 1970s face structural challenges as energy exporters increasingly accept alternative settlement currencies.

Currency swap arrangements between non-U.S. central banks proliferate, creating parallel payment systems bypassing dollar intermediation. While remaining small relative to global trade volumes, growth trajectories suggest gradual, persistent erosion of dollar network effects. Transitions from unipolar monetary systems to fragmented, multipolar arrangements carry profound fiscal sustainability implications; reserve currency status historically permitted deficit financing at lower costs than otherwise possible.

Cryptocurrency complexes, despite periodic collapses and regulatory crackdowns, continue attracting capital flight from distressed jurisdictions. Bitcoin and Ethereum volatility serves as barometer for traditional monetary arrangement confidence. Continued existence and periodic rallies suggest persistent government-issued currency alternatives demand, even among populations never experiencing developing-nation hyperinflations.

Contagion Beyond Borders

No September 2026 economic analysis completes without examining international dimensions. Modern financial market interconnectedness ensures distress anywhere becomes distress everywhere – transmitted through trade flows, capital movements, and contagion effects defying geographic boundaries.

Over 54 countries currently stand in or near debt distress per International Monetary Fund assessments. That figure, representing over one-quarter of world nations, encompasses economies ranging from small island states to major regional powers. JPMorgan EMBI spreads between emerging-market dollar debt and U.S. Treasuries widened 17 basis points to 268 basis points since late February 2026, with particular stress in Egyptian debt (44 basis point widening) and Turkish obligations (36 basis point increases).

Argentina continues perpetual crisis-stabilization cycles, with inflation moderating from catastrophic levels yet structural vulnerabilities remaining unaddressed. Pakistan and Egypt, heavily dependent upon IMF support and Gulf state beneficence, face refinancing cliffs potentially triggering broader regional instability. World Bank reports indicate 29% of low-income country bonds mature by 2026, creating refinancing walls that could overwhelm available resources if market conditions deteriorate.

Structural shifts in emerging market debt composition offer limited comfort. While many nations reduced foreign currency-denominated obligations – lowering exchange rate shock vulnerabilities – remaining dollar debt concentrates in sectors with limited revenue flexibility. Sovereign borrowers shifting to local currency issuance find themselves paying substantially higher rates, as domestic capital markets demand inflation premia international investors once absorbed.

China’s economic slowdown compounds pressures. As world’s largest trading nation and commodity importer, Chinese demand contraction transmits directly to emerging market exporters. African nations financing infrastructure through Chinese lending face not merely debt service difficulties but export revenue collapses that might otherwise fund obligations. Latin American commodity producers confront simultaneous demand weakness and dollar strength increasing real debt burdens.

Global trade fragmentation into competing blocs – Western, Chinese, and non-aligned – further complicates adjustment mechanisms. Nations can no longer count on export-led growth resolving balance of payments difficulties when major markets impose tariff and non-tariff barriers. World Trade Organization dispute settlement paralysis leaves aggrieved parties without recourse, encouraging unilateral measures compounding fragmentation.

Institutions Showing Wear

Beyond specific debt figures or delinquency rates, 2026 reveals institutional framework degradation that previously stabilized economic fluctuations. Federal Reserve balance sheet expansion to unprecedented pandemic-era levels now confronts impossible trinities: price stability, full employment, and financial stability – with policy choices addressing one objective frequently worsening others.

“Higher for longer” interest rate environments necessary for inflation combat expose vulnerabilities accumulated during near-zero rate decades. Pension funds, insurance companies, and institutional investors extending duration to capture yield now face mark-to-market losses threatening solvency. Liability-driven investment strategies nearly collapsing UK gilt markets in 2022 remain prevalent in U.S. institutional portfolios, creating latent systemic risks.

Shadow banking – non-bank financial intermediation – expanded filling gaps left by regulated institutions subject to post-2008 capital requirements. Private credit funds, direct lending platforms, and fintech-enabled leverage now constitute parallel financial systems whose opacity frustrates risk assessment. When stress emerges in these channels, traditional lender-of-last-resort facilities may prove inadequate or inappropriate.

Labor markets, while showing low unemployment by headline measures, reveal structural deterioration beneath surfaces. Prime-age male labor force participation remains depressed by standards from earlier decades. Gig economies transformed stable employment into contingent arrangements lacking benefits and income predictability. Artificial intelligence adoption, while boosting aggregate productivity, threatens displacement in specific sectors potentially overwhelming retraining and transition support systems.

Demographic headwinds compound challenges. Developed economy population aging strains pension and healthcare systems precisely when debt service requirements escalate. Worker-to-dependent ratios continue declining, threatening tax bases that must support both elderly benefits and debt service. Immigration, which might address labor shortages, faces political opposition constraining policy responses.

“The real problem isn’t any single vulnerability in isolation. It’s how they correlate. When sovereign debt stress, household financial distress, commercial real estate deterioration, and banking fragility hit simultaneously, standard diversification strategies stop working. No asset class thrives when everything else falters. No jurisdiction offers refuge when contagion goes global. We’ve essentially made one big bet – that monetary expansion and fiscal forbearance can continue indefinitely. Eventually, that bet runs into basic arithmetic.”

Reading the Dashboard: September 2026 Data:

Why the Warning Signs Go Unnoticed

Surface-level indicators in September 2026 create strange disconnects. Consumer confidence indices fluctuate yet remain above typical recessionary thresholds. Equity markets, despite volatility, trade near highs by some measures. Unemployment at 4.1% as of August 2026 appears benign.

Several factors explain gaps between quantitative reality and qualitative perception. Asset price inflation during 2020-2021 created substantial wealth effects continuing to support consumption among asset-owning households. Homeowners and equity portfolio holders feel wealthier than underlying conditions suggest, even as renters and non-asset owners face unprecedented affordability constraints.

Normalization of extraordinary monetary policy shifted baseline expectations. Generations of investors and consumers never experienced genuine tightening cycles; brief 2023-2024 rate increases were followed by expectations of renewed accommodation. “Higher for longer” concepts remain psychologically unavailable to market participants building careers during secular interest rate declines beginning in the early 1980s.

Government transfer payments and forbearance programs masked underlying income instability. Student loan payment pauses, mortgage forbearance options, and expanded pandemic-era unemployment benefits created official support expectations that may not sustain. When these programs expire – and many are scheduled for late 2026 and early 2027 – true household balance sheet fragility becomes apparent.

Denial psychology operates institutionally too. Regulatory forbearance allows banks avoiding loan loss recognition. Accounting standards provide asset valuation latitude permitting “mark to model” rather than “mark to market” approaches. Credit rating agencies, chastened by 2008 failures, may overcompensate through excessive issuer optimism.

Collective denial serves short-term functional purposes. If all market participants simultaneously acknowledged vulnerabilities described here, resulting panic would become self-fulfilling. Yet denial costs include postponed adjustment magnifying eventual dislocation. Delayed recognition brings more severe ultimate reckonings.

Sector by Sector: Where the Pressure Builds

Technology, despite artificial intelligence enthusiasm, entered consolidation phases marked by layoffs and valuation compression. “Magnificent Seven” stocks driving 2023-2024 returns showed divergent performance, some facing regulatory challenges, others confronting demand saturation. Venture capital funding contracted dramatically from 2021 peaks, forcing startups into down rounds or closures.

Healthcare costs escalate inexorably, with implications for federal budgets and household finances. Medicare Hospital Insurance trust funds face depletion during mid-2030s under current projections, yet political gridlock prevents structural reforms ensuring sustainability. Pharmaceutical price controls, while popular, may reduce innovation incentives generating mRNA technologies crucial to pandemic responses.

Energy markets exhibit volatility characteristic of transition periods. Renewable capacity additions continue at record rates, yet fossil fuels retain transportation and industrial dominance. Geopolitical supply chain disruptions – whether from Middle Eastern conflicts, Russian sanctions, or shipping interruptions – create price spikes feeding through inflation metrics and consumer sentiment.

Manufacturing, despite reshoring rhetoric, struggles with competitiveness against Chinese and other Asian producers. Domestic production capital intensity, combined with regulatory compliance costs and labor market rigidities, limits industrial recovery pace. Tariffs and trade barriers, while providing temporary protection, raise input costs and invite retaliation harming export-oriented sectors.

Agriculture faces climate-related stresses compounding traditional cyclical challenges. Drought conditions in major producing regions, combined with water rights disputes and input cost inflation, threaten farm profitability and food security. Foreign agricultural land ownership, increasing over 40% between 2016 and 2024 with Chinese entities controlling approximately 384,000 acres, raises national security concerns intersecting economic policy.

Policy Gridlock and Institutional Constraints

Responses to accumulating stresses proved notably inadequate. Monetary authorities, having exhausted conventional tools during previous crises, face constraints limiting new shock responses. Federal Reserve cannot cut rates substantially without reigniting inflation; cannot raise them without triggering debt service crises described earlier. Quantitative tightening reduced balance sheet holdings, yet remaining reserves and securities still represent extraordinary intervention by past standards.

Fiscal policy faces similar constraints. With debt service consuming nearly 14% of federal outlays and projections exceeding 15% within two years, substantial new spending initiatives face automatic opposition from deficit hawks and market vigilantes. Tax increases, while potentially necessary for sustainability, face political opposition making enactment improbable. Results include passive tightening through inflation and bracket creep falling most heavily upon middle-income households.

Regulatory policy oscillates between permissiveness and restriction without coherent strategy. Environmental mandates increase energy-intensive industry costs; financial regulations impose compliance burdens favoring large institutions over regional competitors; labor regulations create rigidities impeding adjustment. Cumulative effects discourage investment necessary for productivity growth.

International coordination broke down precisely when most needed. G20, IMF, and World Bank lack credibility and resources addressing systemic risks transcending national boundaries. Currency wars, trade disputes, and technological competition replaced cooperation characterizing post-2008 crisis management. Each nation pursues narrowly defined self-interest, ignoring collective action problems requiring coordinated solutions.

How Crises Spread

Understanding localized stress becoming systemic crisis requires examining transmission mechanisms. Most obvious channels are financial: losses in one sector force asset sales depressing prices in others, creating mark-to-market losses triggering further forced selling. Reflexivity – described by George Soros – can transform modest corrections into cascading collapses when leverage proves pervasive.

Credit channels operate similarly. Rising delinquencies in one sector prompt lenders tightening standards across all sectors, reducing availability precisely when most needed smoothing consumption and investment. Credit creation’s procyclical nature amplifies business cycles, transforming mild downturns into severe recessions.

Confidence channels prove most dangerous because least susceptible to policy intervention. When economic agents lose future faith, they reduce spending and investment regardless of interest rates or fiscal stimulus. Animal spirit collapses become self-fulfilling as reduced demand generates feared outcomes. Money velocity declines, rendering monetary expansion ineffective.

International transmission occurs through trade, capital flows, and commodity prices. Developed economy recessions reduce emerging market export demand; capital flight from distressed jurisdictions raises global funding costs; commodity price collapses devastate resource-dependent economies. Dollar reserve currency status creates additional complications: dollar strength during crisis periods raises real debt burdens for dollar-denominated borrowers worldwide.

Learning from the Past – Carefully

Students of economic history naturally seek parallels. 1970s stagflation offers lessons about inflation control difficulties once expectations become unanchored, yet today’s debt levels far exceed that era’s. 2008 financial crises demonstrate confidence evaporation speeds, but current vulnerabilities distribute differently – across sovereign balance sheets rather than subprime mortgages. Japan’s 1990s experiences illustrate failure-to-recognize-loss costs, yet Japan’s current account surpluses provided cushions unavailable to contemporary deficit nations.

Each analogue breaks at crucial points. Global integration of modern financial markets, derivative exposure scales, information transmission speeds, and current political fragmentation create unique conjunctures defying simple comparison. Past knowledge provides essential context, yet cannot substitute for present condition analysis.

What history teaches unequivocally: unsustainable trajectories eventually correct. Debt growing faster than income cannot be serviced indefinitely. Asset prices exceeding fundamental values eventually revert. Political systems failing economic challenges lose legitimacy. Correction timing remains inherently unpredictable, dependent upon specific catalysts and confidence thresholds unobservable directly until breached.

Possible Paths Ahead

As 2026 progresses toward conclusion, several scenarios appear plausible, though relative probabilities shift with each data release and policy announcement.

“Soft landing” scenarios, still embraced by official forecasts, assume inflation moderating without triggering recession, debt service costs stabilizing as growth outpaces interest rates, and structural reforms addressing long-term challenges before they become acute. These outcomes, while theoretically possible, require assumptions about productivity growth, demographic adjustment, and political compromise appearing increasingly heroic.

“Stagflationary drift” scenarios envision continued moderate growth accompanied by persistent inflation and gradual living standard erosion. Here, debt service consumes growing national income shares, investment lags depreciation, and each generation finds itself materially worse off than predecessors. Japanification hypotheses applied to the United States – prolonged malaise rather than acute crisis.

“Sudden stop” scenarios involve sovereign debt confidence losses triggering currency crises, capital controls, and emergency austerity. Foreign investors refusing maturing obligation rollovers force either default or monetization generating hyperinflation. These extremes become more probable as debt levels rise and political dysfunction prevents preemptive adjustment.

“Contagion cascade” scenarios begin with shocks in one sector or jurisdiction transmitting globally through financial linkages. Major sovereign defaults, banking system collapses, or geopolitical events trigger reflexive dynamics described earlier, overwhelming policy responses and generating economic contractions exceeding anything since the 1930s.

Each scenario implies different optimal household, investor, and policymaker strategies. Yet uncertainty surrounding which materializes – indeed, possibilities that elements might combine unforeseen ways – paralyzes decision-making and encourages short-termism exacerbating underlying vulnerabilities.

What Comes Next

Analysis presented here suggests 2026’s remainder and 2027’s opening will prove decisive. Milestones loom: fiscal year 2026 conclusions with projected $2.67 trillion deficits; student loan payment full-scale resumption; commercial real estate loan maturities that cannot be refinanced at current rates; and potential geopolitical events disrupting energy markets or trade flows.

Policy responses to these challenges determine whether systems stabilize or deteriorate more rapidly. Technical sovereign obligation defaults remain unlikely immediately; the United States retains reserve currency status and deep domestic capital markets providing financing flexibility unavailable to emerging markets. Yet financing costs – measured in inflation, currency depreciation, or future tax burdens – continue escalating.

Household imperatives center on debt reduction and liquidity maintenance. Variable-rate obligation holders face rising service costs; fixed-rate asset holders benefit from inflation eroding real debt burdens. Monetary policy distributional consequences – favoring asset owners over wage earners – will continue shaping political economy.

Investor challenges involve navigating volatility while preserving capital. Traditional diversification strategies may prove inadequate when correlations converge toward unity during crisis periods. Searches for uncorrelated returns – whether commodities, alternative assets, or geographic diversification – will intensify even as such opportunities become scarcer.

Policymaker windows for preemptive adjustment narrow daily. Structural entitlement program, tax structure, and regulatory framework reforms require political capital dissipating as elections approach and polarization intensifies. Temptations postponing difficult choices – hoping growth resolves arithmetic impossibilities – will prove irresistible until markets impose discipline more painfully than voluntary adjustments would have required.

Final Assessment

September 2026’s economy has not collapsed. Production and exchange machinery continues functioning; most citizens maintain employment and shelter; governance and finance institutions retain forms if not substance. Yet quantitative evidence assembled here – $40 trillion debt, $1.3 trillion interest burdens, 12.8% credit card delinquency rates, $875 billion commercial real estate maturity walls, 54 distressed nations – suggests systems approaching limits that cannot be indefinitely extended.

Questions are not whether adjustments occur, but when and in what forms. Postponements through accounting gimmicks, regulatory forbearance, and monetary accommodation make eventual manifestations more severe. Societies borrowing $2.67 trillion in single years to maintain consumption cannot do so indefinitely. Arithmetic remains inexorable, even when politics refuses acknowledgment.

What emerges from this analysis is not imminent catastrophe prediction but fragility recognition demanding preparation. Specific crisis triggers – whether sovereign defaults, banking panics, currency collapses, or geopolitical shocks – matter less than underlying conditions making such triggers effective. Those conditions are now present to degrees unmatched since 2008, and in certain respects unmatched in modern experience.

Careful observers tracking data without official optimism or partisan narrative filters can see signs. They appear in monthly Treasury statements, quarterly household debt reports, daily credit spread and currency market movements. They accumulate between headline silences, in financial statement footnotes, in budget projection assumptions.

Acknowledging these vulnerabilities is not pessimism surrender but rationality exercise that economic analysis demands. Problem recognition precedes all problem addressing. Evidence presented here suggests recognition is long overdue, and further delay costs will be measured in trillions of dollars and millions of livelihoods. Systems continue running, but those paying close attention can hear the strain.


Tyler Durden
Tue, 09/22/2026 – 21:45

New York Is Hemorrhaging Young People To Philadelphia

0
New York Is Hemorrhaging Young People To Philadelphia

New York continues to attract ambitious young people, but apparently it’s also getting pretty good at showing them the door.

The metro area recorded the largest net loss of Gen Z residents in the country in 2024, with nearly 30,000 more young adults leaving than arriving, according to Census data analyzed by Redfin, according to the NY Post. Millennials were even more eager to pack up, producing a net outflow of almost 43,000 people ages 28 to 43.

The Post writes that a sizable portion of those departures didn’t involve moving halfway across the country. More than 9,200 Gen Z residents went from the New York metro area to Philadelphia, making it the second-busiest migration route for that generation nationwide. Only the roughly 60-mile move from Los Angeles to Riverside attracted more Gen Z movers.

The economics aren’t particularly difficult to understand. Redfin estimates a typical New York-area home costs roughly $832,000, compared with about $309,000 in Philadelphia. That leaves plenty of room for someone to trade New York for a cheaper city while remaining close enough to friends, family and jobs in the Northeast.

And then there are New York’s famously welcoming taxes. Between state and city income taxes, eye-watering housing costs and the general expense of existing within the five boroughs, New York has constructed a fairly impressive financial obstacle course for anyone trying to accumulate savings or buy a home.

Apparently, some younger residents have discovered that one solution to the affordability problem is simply crossing a state line.

The trend extends beyond New York. Los Angeles also experienced sizable departures, with San Diego and Riverside among the most common destinations for Gen Z movers. Millennials, meanwhile, gravitated toward metros including Houston, Dallas, Baltimore, Las Vegas and Atlanta, where housing generally remains considerably cheaper than in the largest coastal cities.

The numbers suggest younger Americans aren’t necessarily searching for the absolute cheapest place to live. Instead, many appear to be making relatively short moves that improve affordability or employment prospects while keeping their existing social and professional connections within reach.

Redfin based its findings on the Census Bureau’s 2024 American Community Survey, defining adult Gen Zers as ages 19 to 27 and millennials as ages 28 to 43.

Tyler Durden
Tue, 09/22/2026 – 21:20

The West Might Soon Ramp Up Its Pressure On India To Distance Itself From Russia

0
The West Might Soon Ramp Up Its Pressure On India To Distance Itself From Russia

Authored by Andrew Korybko via Substack,

The US and France seem to be coordinating a concerted pressure operation against India…

Popular Russian outlet Izvestia raised awareness of a paywalled Bloomberg report alleging that India might reduce its import of Russian oil, which was 45% of its total last month, to avoid US tariffs of up to 100% after Trump recently signed into law a bill empowering him to punish Russia’s top energy partners. Earlier in September, “India’s Top Diplomat Signaled That It’ll Defy Any New US Pressure Over Its Russian Oil Purchases“, which are considered to be indirectly essential to its national security.

Such pressure might soon pile up too, however, as suggested by more than just the aforesaid punitive tariff bill’s passing. The US and China are negotiating an extension to their trade war truce ahead of Xi’s visit later this week. The current disagreements primarily concern its duration according to the Financial Times. In the event that any such extension is ultimately agreed to, then the US presumably won’t impose punitive tariffs on China for its Russian oil purchases, which would draw attention to India’s.

Although the US benefits from India’s Russo-American balancing act since the strategic benefits that India derives most effectively empower it to serve as a counterweight of sorts to China, Trump 2.0 might nevertheless become “geopolitically greedy” and want the US to become India’s senior partner. In that scenario, the threat of punitive tariffs over its Russian oil imports could be leveraged as a Damocles’ sword to pressure India into gradually reducing them in parallel with joining the West’s Hormuz coalition.

About that, the French Foreign Minister proposed jointly working with India on ensuring “freedom of navigation in the Strait of Hormuz and the Bab el-Mandeb Strait” during talks with his counterpart on the sidelines of the UNGA. This coincided with the French and US presidents agreeing to work on the Hormuz dimension according to Emmanuel Macron’s tweet after his talks with Trump. India’s potential participation in the West’s Hormuz coalition, albeit under tariff duress if it happens, would be significant.

For starters, it would signify that the US decided to pressure India over its Russian oil imports while turning a blind eye to China’s for the duration of their likely extended trade war truce, thus suggesting that the US is more comfortable bullying India on this issue than China.

Second, India’s participation would confirm that such tariff-related pressure was successfully weaponized by the US,

…with the third significance being that India joined the coalition in order to unlock alternative oil supplies to Russia’s.

Fourth, Russian policymakers would notice the US’ successful policy of coercing India through tariffs-related pressure into distancing itself from their country, which could lead to them concluding that it’s incapable of functioning as a reliable counterbalance to China.

The implication is that Russia might tighten its embrace of China with all that could entail for ties with India. And finally, India’s association with a Western naval coalition could harm its hard-earned neutral reputation in the Global South’s eyes.

France’s involvement in coordinating what seems to be a concerted pressure campaign by the US against India is notable since it’s now India’s second-largest arms partner and has been eroding Russia’s market share over the past decade. It therefore can’t be ruled out that the US might threaten more CAATSA sanctions against India if its threatened tariffs are successful in order to accelerate the aforesaid trend. India’s participation in the West’s Hormuz coalition might thus bode ill for its future ties with Russia.

Tyler Durden
Tue, 09/22/2026 – 20:55

NYC Tossed Out Roughly 46,000 NYPD Civil Summonses Last Year Due To Errors

0
NYC Tossed Out Roughly 46,000 NYPD Civil Summonses Last Year Due To Errors

New York City is throwing out tens of thousands of low-level summonses issued by the NYPD, with the department’s reliance on pen-and-paper ticketing contributing to the problem, according to Gothamist.

Of roughly 98,000 civil summonses issued by police during the last fiscal year, about 46,000 were dismissed by the city’s administrative court system, according to data obtained by Gothamist. That works out to roughly 47%.

The tickets stem from offenses such as drinking alcohol in public, public urination, illegal vending and pedicab violations. Many never survive the administrative process because of paperwork problems rather than the underlying allegation.

The NYPD remains unusual among city agencies because officers still issue civil summonses entirely by hand. That can produce everything from unreadable writing and incorrect violation codes to omitted details and mistakes made when paper records are later entered into city databases.

Example of civil summons (Gothamist)

City watchdogs flagged the issue years ago. A 2020 Department of Investigation review recommended moving agencies away from paper summonses and toward digital ticketing. The NYPD at one point agreed to make the transition but has yet to implement an electronic system.

Gothamist writes that other departments have already moved in that direction. The Department of Buildings now issues about 80% of its summonses electronically. Its dismissal rate last fiscal year was approximately 13%, far below the NYPD’s 47%.

Government transparency and legal advocates argue the current system burns administrative resources while requiring people to contest tickets that may be invalid from the outset. City Councilmember Gale Brewer is considering legislation that could force the NYPD to switch to electronic summonses.

The NYPD maintains that officers are properly enforcing the law and says many of the dismissed cases failed because of procedural or paperwork errors rather than the substance of the alleged violations. The department says additional officer training is underway to reduce those mistakes.

Tyler Durden
Tue, 09/22/2026 – 20:30

Pentagon Unveils New Testing Process For US Generals

0
Pentagon Unveils New Testing Process For US Generals

Authored by Jackson Richman via The Epoch Times,

The Pentagon is changing its process for promoting generals, Secretary of War Pete Hegseth announced on Sept. 22.

Hegseth announced the new process, known as the Joint Warfighter Evaluation, in a video posted on X.

Its goal is to reduce bureaucracy and ensure meritocracy across senior ranks, he said.

Starting this year, colonels and Navy captains screening to be a one-star general will undergo the assessment, according to Hegseth.

“While the backbone of our military is our NCOs and our petty officers, victory depends on the commanders who lead them,” he said.

“America needs warfighters who can master a chaotic battle space.”

Hegseth cited Gen. George Marshall using the Louisiana Maneuvers, a massive series of military exercises to prepare U.S. forces before entering World War II.

He said that this kind of testing brought out military leaders such as Dwight Eisenhower, who planned and conducted the U.S. invasion of Normandy and led the liberation of Western Europe; Adm. Chester Nimitz, who led Allied air, land and sea in the Pacific theater during World War II; and Army Gen. Omar Bradley, the first chair of the Joint Chiefs of Staff who led the U.S. military’s policymaking during the Korean War.

The Joint Warfighter Evaluation “brings that standard to the modern multi-domain fight,” Hegseth said.

“This evaluation is an objective equalizer. The scenario only cares about operational decisions under pressure.”

Hegseth recalled that a year ago he tasked Stuart Scheller, deputy chief of staff to the under secretary of war for personnel and readiness, to challenge years of the promotion process.

“Our troops deserve commanders chosen by proven competence, not paper credentials,” Hegseth said.

“The Joint Warfighter Evaluation ensures our flag is carried by our most lethal and most adaptable leaders.”

Hegseth has emphasized what he calls the “warrior ethos,” pushing for battle-ready personnel based on a high level of fitness. He has criticized what he said has been diversity, equity, and inclusion standards in promoting individuals.

“Real toxic leadership is endangering subordinates with low standards. Real toxic leadership is promoting people based on immutable characteristics or quotas instead of based on merit,” Hegseth told senior military leaders last year in Quantico, Virginia.

While the process of promotion to general is being changed, the Joint Warfighter evaluation is not replacing the existing promotion process, Scheller told Fox News Digital. Rather, it is a factor in addition to performance reports and an officer’s career record.

Tyler Durden
Tue, 09/22/2026 – 20:05

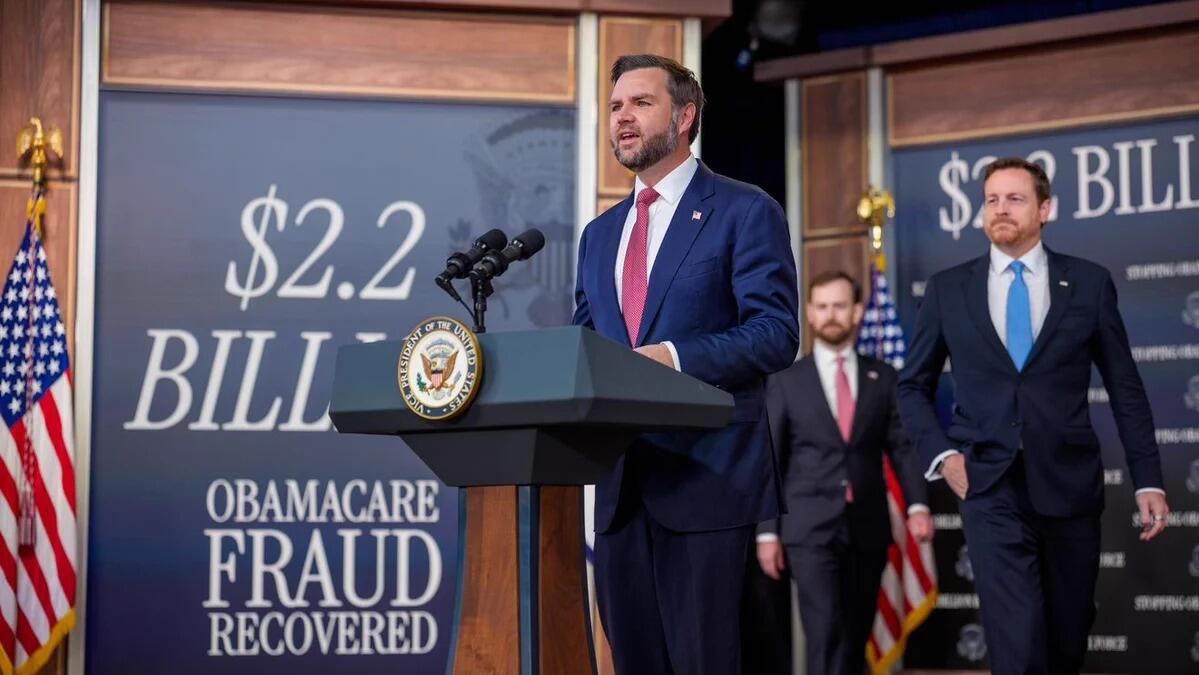
White House Cancels Coverage For 750,000 ACA Enrollees, Citing Fraud

0
White House Cancels Coverage For 750,000 ACA Enrollees, Citing Fraud

Vice President JD Vance said Tuesday that about 750,000 people on Affordable Care Act plans were never entitled to the coverage, and that pulling their subsidies will save taxpayers $2.2 billion. Mehmet Oz, who runs the Centers for Medicare and Medicaid Services, stood with him. The savings number is an administration estimate. The Congressional Budget Office has not scored it.

CMS had already acted. Rulemaking documents posted Tuesday in the Federal Register say the agency canceled 315,000 marketplace policies on Aug. 31, covering roughly 760,000 people, which the rule describes as unauthorized enrollments submitted through agents and brokers. Vance’s 750,000 and the 760,000 covered lives are the same purge, counted two ways.

Officials also plan another pass at about 419,000 current enrollees, checking legal residency first and income second. “We are actually making sure that people receiving Obamacare subsidies are actually entitled to receive them,” Vance said. “Amazingly we weren’t doing that before.”

Brokers are next. CMS sent notices of intent to terminate to 569 agents and brokers who filed statistically implausible rates of 2026 applications without identifying information, such as a Social Security number. A separate interim-final rule freezes new agent and broker registrations until Feb. 1, 2027, before the usual comment period runs. Administration officials said 40 brokers accounted for about 50,000 suspect enrollments and $45 million in subsidies. The National Association of Benefits and Insurance Professionals said a blanket freeze punishes licensed agents who did nothing wrong and will leave consumers with fewer people to call during open enrollment.

Centene fell as much as 3.9 percent on the first headlines. Molina dropped as much as 3.5 percent, Elevance 1.9 percent, UnitedHealth 1.4 percent. Those firms write a large share of exchange business. Federal premium tax credits are paid to the insurer, not the enrollee.

How The Administration Is Using The Word

Part of the case is conventional fraud. Brokers collect commissions from insurers. After Congress fattened the premium tax credits, a lot of low-income plans carried a $0 net premium, so a policy could be opened without the customer ever seeing a bill. CMS recorded roughly 275,000 complaints in an eight-month stretch of 2024 from people who said they had been enrolled or switched without consent. In February, a brokerage president and a marketing-company CEO were sentenced to 20 years each for a scheme that sought more than $233 million in subsidies. HHS has separately said more than a million marketplace enrollments listed no Social Security number.

The rest is a verification net the last administration loosened and this one is pulling tight: income attestations, immigration paperwork, employer coverage, automatic re-enrollment onto free plans.

The Government Accountability Office has found the same weak controls and has not signed off on the claim that millions of current enrollees are fake. GAO flagged at least 160,000 federal-marketplace applications in plan year 2024 for likely unauthorized changes, about 1.5 percent of the relevant pool. It found about 68,000 Social Security numbers used for more than a year of subsidized coverage in 2024; one number appeared on 125 policies. About $94 million in subsidies went out on numbers that matched the death file. Undercover testers got fictitious applicants approved at very high rates, and most of the 2025 fakes were still drawing subsidies months later. GAO has described that work as a set of risk indicators, not a census.

HHS and the Paragon Health Institute produce the bigger tallies. Paragon compares people who signed up claiming income between 100 and 150 percent of poverty – the band that unlocked the largest subsidies – with Census estimates of how many people in that band could even qualify. Whatever is left over gets labeled improper. HHS instead measures how many enrollees in that band filed no claims, against historical norms. HHS put the peak at 5.6 million in 2025 and said 2.6 million are still on the books. Paragon’s 2026 figure is about 6.2 million, or 27 percent of open-enrollment selections, with a possible price tag of $25 billion.

Census income is not the projected income the marketplace uses. The survey misses low-income households. People with no claims get counted as phantoms; they are also just people who did not go to the doctor, or who bought a bronze plan with a deductible they never hit. In June, a federal judge in Maryland vacated most of a 2025 rule the administration had justified with Paragon-style estimates, ruling that CMS had overridden the statute. CMS’s own paperwork this week floated a different improper-spending figure for 2026: up to $6.6 billion.

Enrollment Was Already Falling

Exchange enrollment ran from about 12 million early in the Biden term to a peak near 24 million once the extra subsidies landed and verification eased. Congress let those add-on credits expire. Premiums jumped, in some markets doubling. By February, effectuated enrollment was about 19.2 million, down 13 percent from a year earlier and the sharpest drop since the exchanges opened.

The White House credits integrity work. KFF and the Center on Budget and Policy Priorities credit the price spike. A phantom account that never should have existed and a family that quit after the bill hit $200 a month both show up as cancellations.

Open enrollment starts Nov. 1. Midterms are Nov. 3. Earlier this month Trump told a Republican midterm convention in Dallas that his “Great Healthcare Plan” would “stop all government payments to the big insurance companies.”

Some of the 760,000 were never patients. They were names on a file, opened without their knowledge. Killing those policies stops a check to an insurer and a commission to a broker. Some of the 419,000 in the next pass will lose coverage because they cannot produce papers on the new timeline, including people who were eligible. Democrats have been saying that out loud for months: fraud talk as the instrument for a coverage cut Congress already started by killing the extra subsidies.

CMS has stopped payment on the August book and is closing the broker door. It has not released a table that splits the 760,000 into fictitious accounts, unauthorized switches, income or immigration mismatches, and eligible people who missed a form. Without that, $2.2 billion is still an estimate and 750,000 is a cancellation count.

Tyler Durden
Tue, 09/22/2026 – 19:40

Bessent Emerges As “AI Czar” Frontrunner

0
Bessent Emerges As “AI Czar” Frontrunner

Fresh off his recent spat with “Doomsday Dario”, whom he scolded for his apocalyptic essay (which was attempted regulatory capture in all but name) and warned that the US government will not serve as a “liability shield” to the frontier AI company,  Treasury Secretary Scott Bessent appears to be one step closer to directly taking AI matters into his own hands. 

According to Semafor, Bessent is emerging as a frontrunner for President Donald Trump’s new “AI czar” position, after long playing a central role in the Trump administration’s AI policy. This week Bessent held an early dialogue with Chinese Vice Premier He Lifeng on the sidelines of the UN General Assembly, ahead of Trump’s meeting with Chinese leader Xi Jinping. Among the topics discussed, Bessent and He spoke about a potential US-China “notification mechanism” to facilitate communication about AI incidents that pose threats to national security, as part of what Bessent said were talks about a formal US-China dialogue on AI.

Other names in the mix for the czar position include White House Office of Science and Technology Policy Director Michael Kratsios, a longtime Trump ally on tech, and Office of Personnel Management Director Scott Kupor, who left VC giant a16z to join the government.

“When President Trump talked about appointing an AI czar, I think it is to put context, shape and contours around these questions, and they’re very important,” Bessent told CNBC earlier this week, adding that he thought humans are ultimately responsible for what AI does.

The Treasury chief became an active participant in AI policymaking earlier this year after financial institutions told him advanced AI systems could make their systems vulnerable.

As Semafor cautions, Trump’s decision on his AI point person is not final, and he is known to ultimately favor dark-horse candidates. But if Bessent were to ultimately get tapped, his Cabinet job wouldn’t be a barrier — Interior Secretary Doug Burgum has simultaneously held the “energy czar” moniker.

“Any reporting about personnel decisions that have not been officially announced by the administration should be regarded as baseless speculation,” White House spokesman Kush Desai said.

Tyler Durden
Tue, 09/22/2026 – 17:20

Foreign Actors Disrupt 2 Colorado Water Systems: Governor’s Office

0
Foreign Actors Disrupt 2 Colorado Water Systems: Governor’s Office

Authored by Kimberly Hayek via The Epoch Times,

Foreign actors gained access to computer systems at two small private water utilities in Colorado in late August, changing equipment controls before operators restored normal operations, according to the governor’s office.

Ally Sullivan, a spokeswoman for Gov. Jared Polis, said the Colorado Department of Public Health and Environment followed up with the providers to confirm the issues had been resolved. The governor’s office said it was unable to confirm which foreign actors and did not identify the utilities.

“The two water utilities impacted are small, private water providers that serve fewer than 200 people,” Sullivan said in a statement to media outlets.

“The providers acted promptly and there was no impact to public safety or water services. We cannot confirm what foreign actors may have been involved, but we are aware of ongoing efforts across the nation by an Iranian-backed group to access drinking water and wastewater systems, as per the Cybersecurity and Infrastructure Security Agency.”

Sullivan did not immediately return a request for comment from The Epoch Times.

Treatment processes and water quality were not affected at either provider, according to the governor’s office.

The Colorado incidents occurred weeks after a series of cyberattacks impacted water and wastewater systems in multiple states. Federal agencies had already flagged the threat.

In an Aug. 19 advisory, the FBI, National Security Agency, Cybersecurity and Infrastructure Security Agency (CISA), and other agencies warned of an active cyber threat to Siemens S7 Series programmable logic controllers (PLC) used in water systems and other critical infrastructure.

The advisory said unnamed threat actors were conducting reconnaissance and capability development against the U.S.-based Siemens PLC installations, using AI-generated exploitation scripts disguised as legitimate monitoring tools. It noted that the hackers sought internet-connected PLCs running outdated software or that were otherwise poorly protected.

“The U.S. critical infrastructure sectors most targeted by this threat activity include Critical Manufacturing, Energy, Water and Wastewater, Chemical, Food and Agriculture, and Commercial Facilities,” the advisory stated.

“This is not a theoretical risk – it is an active threat.”

The advisory came amid reports of incidents targeting local water systems in several states in the preceding weeks. The FBI said that from July 27 to July 30, water and wastewater utility companies in seven states reported security-related incidents.

Michigan was among those states. Dale George, director of communications for the Michigan Department of Environment, Great Lakes and Energy, said that the state received the FBI’s notice warning of attempts to tamper with operational technology at water systems.

“All systems continued to operate safely, issues were addressed by local operators, and there are no known impacts that posed a public health concern,” George said.

Earlier in July, more than 30 community water systems in Minnesota reported a coordinated cyberattack. CISA urged water entities of all sizes to protect operational technology against activity targeting PLCs.

Attackers had targeted internet-facing Rockwell Automation and Allen-Bradley MicroLogix controllers, changing passwords and IP addresses. Some effects included loss of pressure. Federal officials warned that a significant pressure drop can allow untreated groundwater to enter drinking water pipes.

Reuters contributed to this report.

Tyler Durden
Tue, 09/22/2026 – 17:00

Man At Risk Of Losing $95,000 Plane For Transporting Unopened Six Pack Of Beer Takes His Case To SCOTUS

0
Man At Risk Of Losing $95,000 Plane For Transporting Unopened Six Pack Of Beer Takes His Case To SCOTUS

The Supreme Court will consider whether Alaska went too far when it confiscated a pilot’s $95,000 airplane over an attempt to bring beer into a dry community, according to Yahoo News.

The case dates to 2012, when longtime Alaska charter pilot Ken Jouppi agreed to fly a passenger from Fairbanks to Beaver, where alcohol was prohibited. The passenger had 72 cans of beer in her luggage. Most were boxed, but a six-pack was visible in a grocery bag.

Troopers found the alcohol before takeoff. Jouppi was convicted of a misdemeanor after a court determined he had been willfully blind to the beer. He received three days in jail and a $1,500 fine, but Alaska law also required forfeiture of his airplane, worth about $95,000.

The Alaska Supreme Court upheld the seizure, reasoning in part that illegal alcohol imports contribute to the broader problems caused by drinking in rural communities. The U.S. Supreme Court agreed to review the decision and will hear arguments in Jouppi v. Alaska on December 1.

Yahoo writes that the Cato Institute, backing Jouppi, argues that the state’s approach gives too little weight to what Jouppi himself actually did and how severe the punishment was relative to his offense. Its brief points to a legal tradition stretching back to the Magna Carta, which held that punishment for a “trivial offence” should reflect the seriousness of the conduct and should not be so large as to destroy someone’s livelihood.

Cato also cites the Supreme Court’s 1998 ruling in United States v. Bajakajian. There, the Court rejected the forfeiture of $357,144 from a man who failed to report that he was carrying the money overseas. The money was legally obtained, the offense caused little direct harm and the Court found the forfeiture excessive.

Jouppi, now 83 and an Air Force veteran with no prior criminal record, argues the same principle applies to his case. His airplane was worth more than 60 times the criminal fine he actually received.

The case could also determine whether a person’s financial circumstances should factor into an excessive-fines analysis. As Justice Clarence Thomas wrote in a separate 2019 forfeiture case, treating identical property seizures as equal punishment would create a fiction “that taking away the same piece of property from a billionaire and from someone who owns nothing else punishes each person equally.”

A ruling for Jouppi could give courts clearer guidance on when property forfeitures cross the Eighth Amendment’s line from punishment into an excessive fine.

Tyler Durden
Tue, 09/22/2026 – 16:40