To mark the 250 year anniversary of the US Declaration of Independence, Deutsche Bank has published a report looking at how the US emerged as a global superpower, and why it’s likely to remain one despite new challenges.
- First, DB considers how the US went from being a comparatively small country to the world’s pre-eminent global power. These reasons range from the US’ natural advantages, like favorable geography, to factors like its institutional stability and risk-tolerant capital markets.
- DB then considers the challenges that threaten US outperformance: China’s rapid growth means the US faces its biggest rival since its own emergence as the world’s dominant power. China’s rise also coincides with several other issues: the rules based international system that the US helped create is under immense strain; the reserve currency status of the US Dollar is under pressure; and the country’s public debt-to-GDP ratio is set to hit new records in the coming years.
- Finally, the bank’s analysts Peter Sidorov and Henry Allen look at why the US is likely to sustain its outperformance, thanks to a collection of reinforcing advantages. In fact, the US has consistently emerged from challenging periods successfully, be that after the Great Depression, the malaise of the 1970s, and again around the GFC and its aftermath.
- The bank concludes with a few lessons for investors and for the rest of the world.
1. The Lessons from History: What underpins America’s Success?
Before delving into the drivers of US success, let us bring with a few highlights of its historical outperformance. Since the United States’ founding, the country has achieved remarkable economic success on a whole range of metrics. For one, the US saw rapid growth in population. It started as a comparatively small entity at its founding, but it quickly surged to overtake the large European countries in the mid 19th century and has continued to outpace them since. And with more people, it was little surprise that US GDP rapidly outpaced other countries too.

This success extends beyond GDP growth. Unlike France or Germany, the US has never had a bout of hyperinflation in its history, with its currency maintaining its value comparatively well. Meanwhile, the US’ long-term equity performance has also been very strong. In the time since equity data is available from the late-19th century, real returns have outpaced the UK and Germany by substantial margins

So what has caused this incredible success?
The first reason, and one of the most critical historically, has been the US’ political and institutional stability. Clearly, there have been moments of intense turmoil, most notably with the Civil War in the 1860s. Its historical path also should not be over-romanticised, with US territorial expansion during the 19th century having many similarities to that of the Old World colonial empires. Nonetheless, the US is incredibly rare in that its political system is recognizably the same over the last 200 years. This relative stability and early development of property rights provided a fertile environment for long-term investments, which in turn has aided economic growth over the centuries.
The second reason is its geographic advantages. The US possesses vast arable land, navigable rivers, large coastlines, and access to two oceans. It therefore found itself more insulated from the destructive effects of the world wars, with productive capacity not impacted in the same way. Moreover, the country borders Mexico and Canada, who in both population and GDP terms are much smaller than the United States, meaning it didn’t face the security risks that many European powers faced over the 19th and early-20th centuries.
The third reason has been its abundance of energy resources, particularly relative to Europe. In large part a corollary of its geographic strengths, this energy abundance has given the US several advantages. First of all, lowering costs for households and industry, which has helped the economy be more resilient against geopolitical shocks. Moreover, with the US becoming a net energy exporter in recent years, it also strengthens the external position.
The fourth reason for the US’ relative success was that its main competitors in Europe were deeply affected by the world wars and wider political turmoil. Their productive and financial capacity was severely degraded, with the destruction causing huge loss of life as well. Even among those who survived, many scientists, engineers and entrepreneurs left for the US in the first half of the 20th century. Whilst not a US “success” as such, this meant that on a relative basis, the US’ divergence widened considerably. Indeed, in the first half of the 20th century, the US economy grew by 5.7 times, Germany by 3.4 times, the UK by 2.0 times, and France by 1.8 times.
The fifth reason for the US’ outperformance is scale. It has a large domestic market of over 300m people, with high average incomes, a common language, and low internal barriers to trade. This has given firms the ability to reach a large-scale domestically before expanding abroad. Indeed, it is notable that 8 of the world’s 10 largest firms are based in the US, whereas none are in Europe.
The sixth reason is the structural advantage of the US Dollar, which remains dominant in global trade and FX reserves. This dollar demand matters because it lowers borrowing costs and raises demand for US Treasuries. In turn, it leaves the US with an exceptional capacity to run bigger fiscal and external deficits without facing a funding crisis, and expands the geopolitical leverage that the US possesses. This has been dubbed the “exorbitant privilege”, and has been a major advantage in recent decades.
The seventh reason is financial depth. The US has a large banking system, but also a wide range of non-bank financing, which means startups have access to other sources of capital. In fact, in the decade from 2013 to 2023, annual venture capital financing was 0.7% of GDP in the US, compared to just 0.2% in the EU. This financial depth is important because innovative firms can often be loss-making for lengthy periods, so countries with bigger pools of patient risk capital are better placed to commercialise new technologies.
The eighth reason is its self-compounding advantages in education and research. The US has many of the world’s strongest research universities, including 7 of the top 10 in the Times Higher Education World University Rankings for 2026. Moreover, this research also has an economic angle, as scientific discoveries feed into startups, workforce training and industrial scale-ups. In turn, this becomes self compounding, because top global talent is attracted to the US, and ensures it remains at the forefront of new sectors such as artificial intelligence.
The ninth reason is its pro-business architecture, including a greater tolerance of business failure than many European systems. For instance, Chapter 11 reorganisation is designed to preserve and restructure viable firms rather than liquidate them. This more positive approach to business failure ties into the empirical literature, which suggests that more debtor-friendly and efficient insolvency frameworks are associated with greater entrepreneurship and innovation.
The tenth reason is adaptability. The cultural acceptance of failure and capacity to reinvent itself have boosted US ability to adapt to the changing world. This has allowed it to navigate repeat boom-and-bust cycles, as well swings of the policy pendulum – between openness and isolationism, between protectionism and free trade – without threatening overall the institutional stability we highlighted above. And while capitalism has been a key underlying driving force, it is pragmatism rather than ideology that have driven continued success over time.
It is also important to note that these advantages do not play out individually, but are mutually reinforcing, with the interaction between them allowing the US to benefit from network and externality effects that few if any countries can match.

US history has been marked by challenges and recoveries
That said, this success story was far from a straight line. US outperformance has frequently been questioned, yet it has repeatedly defied the sceptics, including at numerous points in the last century.
Right from the country’s founding, questions were raised about its long-term potential, and in the Civil War of the 1860s, the nation’s survival was at stake after less than a century.
Even over the past 100 years, which has ostensibly been a period of US pre eminence, there have frequently been doubts. For example, after the Wall Street Crash of 1929, the Great Depression saw unemployment peak above 25% and remain above 10% for an entire decade. The associated stock market collapse saw the S&P 500 fall by -86% from peak-to-trough, not reaching its 1929 peak again until 1954. This was a global shock, but it undermined faith in the US system of freemarket capitalism.
However, the country eventually pulled out of the slump. That started with Franklin Roosevelt’s New Deal program, which helped to restore confidence and economic activity. Then the start of WWII saw economic activity surge even further, particularly as there wasn’t fighting on US soil. By the end of WWII, the US had never been in a stronger position relative to its peers, not least with Europe having to rebuild after the war.
Similar doubts were clear as the US grappled with the various crises of the 1960s and 70s. This period saw major political turmoil and multiple assassinations, including President Kennedy in 1963, his brother and presidential candidate Robert Kennedy in 1968, and civil rights leader Martin Luther King Jr. in 1968. A few years later, Richard Nixon became the first president to resign from office amidst the Watergate scandal. US military power was also facing questions at this time, as the Vietnam War turned into a protracted conflict that also faced substantial domestic opposition.
Then on the economic front, inflation started to gather pace from the late-1960s, surging further after the first oil shock of 1973, leading to a 16-month recession. Measures were imposed to conserve energy, including the National Maximum Speed Limit, which wasn’t repealed until 1995. Then in 1979, a second oil shock drove inflation up again.
This turmoil raised questions about whether policymakers could effectively tackle the crises of the day. In 1979, President Jimmy Carter delivered what was widely referred to as the “malaise” speech, although it was actually called “A crisis of confidence”. He said there was “growing doubt about the meaning of our own lives and in the loss of a unity of purpose for our nation.” He spoke of a “growing disrespect” for institutions, and said how the public often “see paralysis and stagnation and drift.” Even the US president was acknowledging that the country was facing huge issues.
Nevertheless, the US then recovered strongly into the 1980s and 90s. Inflation was tamed, albeit with drastic monetary tightening, and the economy saw rapid growth once it recovered from the early 1980s recession. In 1991, the dissolution of the Soviet Union marked an end to the Cold War, and the 1990s were widely considered a unipolar moment where the US was left as the unmatched global superpower. So
once again, the US came through a period of doubt over its success.
But the unipolar moment proved brief, as the global financial crisis cast fresh doubt over US prestige. Unemployment surged above 10%, and the economy entered an 18-month recession, the longest since the Great Depression. Moreover, the subsequent recovery was very sluggish, with growth rates well below those of previous decades. Economists resurrected the idea of “secular stagnation”, originally put forward by Alvin Hansen in the 1930s, suggesting the US faced an era of permanently slower growth.
These questions about US pre-eminence came as China was growing rapidly at the same time. In 2005, China’s GDP (in USD terms) was still only 18% of the US total, but that surged to 62% by 2015. That was an incredible shift in relative economic weight in the space of a decade.
But for all the doubts of the 2010s, the secular stagnation narrative has since disappeared in the 2020s. The US economy bounced back remarkably quickly from the pandemic, aided by huge quantities of stimulus that were far larger than 2008. Moreover, recent years have seen the US at the forefront of AI developments, raising hopes of a new productivity surge, with its lead extending over the other advanced economies. So yet again today, the US has emerged from a rockier period around the financial crisis and its aftermath, into a relatively strong position that includes the highest GDP per capita of any G7 country.

2. The Challenges Ahead: Why the US now faces a crucial decade
The above discussion highlights how the US has repeatedly overcome periods of doubt, with predictions of American decline proving premature each time. However, in several respects today’s challenges feel more acute. The US is not as dominant a geopolitical power as it used to be, given China’s emergence as a serious rival. Moreover, its debt-to-GDP ratio is on the verge of new records, meaning its fiscal space is far more constrained to deal with new challenges. As such, the next decade will offer a further test of US adaptability, and whether the political system can respond to these interacting pressures.
What are the biggest near-term challenges for the United States?
Since the end of the Cold War, the most significant adjustment has been the end of the unipolar moment and China’s emergence as a genuine peer competitor, which is different in scale and capability from any rival the US has faced since the late-19th century. China has already overtaken the US on manufacturing output, merchandise trade, and GDP (on a PPP basis), and is rapidly closing the gap in advanced technologies and semiconductors. The US retains decisive leads in nominal GDP, capital markets depth, the dollar system, and frontier innovation, but the gap has narrowed substantially.
The military balance tells a similar story. US defense spending remains roughly three times China’s at market exchange rates, but the PPP-adjusted gap is far smaller. More broadly, the gap between US military spending and other major economies has shrunk over the past 15 years. That comes as the proliferation of low-cost precision and autonomous systems is eroding the historic advantages of expeditionary power projection, raising the cost of underwriting the global security order the US has provided since 1945.
We can also see the emergence of Chinese leadership in a whole range of areas. Among others, China accounts for a third of all global manufacturing activity, with a sector as large as the US, Japan, Germany and South Korea combined. The cost of electricity there is a fraction of what people pay in Europe or the US. And just as the US dollar’s role has come under pressure, China is strengthening the global influence of the RMB, in part because of its vast domestic savings surplus.

The emergence of China comes as the rules-based international system designed and led by the US for eight decades is under strain from multiple directions. Admittedly, these strains have not just emerged. Even before the Trump administration, emerging markets had grown in relative size and become less willing to accept Western-designed institutions. Meanwhile, the political support for globalisation has frayed across advanced economies.
But recent US policy choices have raised profound questions about the future global order. In 2025, the US effective tariff rate rose to its highest since the 1930s, representing the largest peacetime trade barrier increase in a century. Strategically, the US alliance network has been an enormous economic asset, underwriting dollar dominance, securing trade routes, and providing the soft-power foundation for global rule-setting. Yet US membership of NATO has become an openly debated question, and tariffs have been raised on US allies as well as rivals.
This uncertainty has contributed to growing pressure on the US’ status as the global reserve currency. The dollar’s share of global reserves has fallen from roughly 72% to 58% over two decades — a gradual decline rather than a collapse, but a clear trend nevertheless. The reduction has accrued to a basket of “non traditional” reserves and to gold, which has seen the largest central bank buying programme in over half a century. In addition to the overall transition away from a 1990s unipolar world, specific factors have added to the challenges that dollar dominance faces. This includes the weaponisation of the dollar through sanctions — notably the freezing of Russian central bank reserves in 2022, which gave non Western-aligned countries a strategic incentive to develop alternatives even at material cost — as well as the structural decline of the petrodollar arrangement as energy trade has fragmented and the US has become a net oil exporter.
Irrespective of the cause, were the US “exorbitant privilege” to erode further, this would bring major costs to the US and allow other currencies to benefit (see note on the potential benefits for the euro). As mentioned earlier, the structural subsidy that the US receives from its reserve currency status includes lower borrowing costs, the ability to run persistent external deficits without the
discipline imposed on other economies and the advantages of the dollar being the unit of account for global trade, commodities and cross-border lending.

None of this implies imminent displacement. No alternative is remotely ready to assume the dollar’s role. Network effects and inertia in trade invoicing and central bank balance sheets all favour continued dollar dominance. Indeed, the pound sterling held a prominent role for many decades after the US had emerged as the world’s largest economy. So the realistic risk for the next decade is not collapse but gradual erosion, with a slow loss of the privilege margin that has boosted US economic performance.
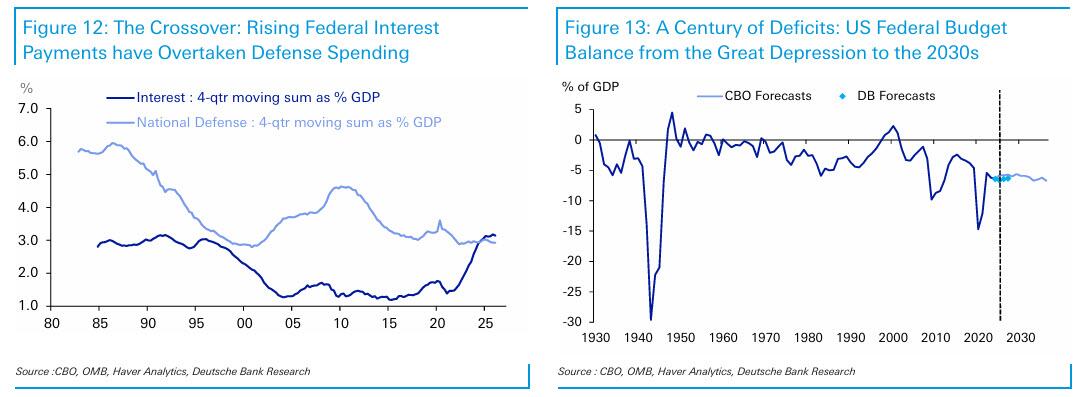
The US fiscal trajectory is the most plausible catalyst to accelerate that erosion, and for institutional investors is the single most concrete macroeconomic risk facing the United States. Over the last four years since 2022, the federal deficit has been consistently running at around 5-6% of GDP. Those are the highest peacetime deficits in US history outside of a major recession, and this is happening in a full employment economy. Debt held by the public is set to surpass 100% of GDP this year, and the CBO projections point to an unsustainable trajectory. Interest payments on the federal debt now exceed defense spending and are the fastest growing line item in the budget.
Most significantly, the binding constraints are now set to arrive within the next decade. The latest estimates project that the Social Security trust fund will be depleted by late 2032, which would trigger an automatic benefit cut absent legislative action. The Medicare hospital insurance trust fund faces a similar reckoning shortly after. So while the unsustainability of the US public debt trajectory has been in the headlines for many years, these events are now more imminent – ones that the next US administration that takes office after the 2028 election will have to face.
To be fair, the fiscal challenge is far from arithmetically catastrophic – a combination of AI-driven productivity growth and moderate fiscal consolidation could lead to significant improvements in the long-term debt profile. The difficulty is whether the political system can deliver such an outcome. Past fiscal consolidations required bipartisan compromise. Yet the current political environment offers little prospect of similar cooperation, with polarisation a mounting issue. Attempts in recent decades (like the Simpson-Bowles Commission in 2010) have failed to gain sufficient support.
In the meantime, demographic trends are compounding both the fiscal and innovation challenges. The US fertility rate has fallen to 1.6 and the dependency ratio is set to deteriorate sharply as the baby boomer cohort fully enters retirement. Even though the population is comparatively younger than many other developed countries, it is still ageing. For example, the UN projects that the share of the US population aged 65 and over will rise from 19% in 2026 to 22% by 2036, rising further to 28% by the end of the century.
An important connecting driver across fiscal, political and demographic challenges has been a rise in inequality. Its steady rise since the 1980s has gone hand-in-hand with a rise in political polarisation, especially once combined with the economic shock that followed the GFC and the sluggish recovery in its aftermath. A corollary of this is that the traditional “American dream” of social mobility has found itself under mounting pressure. The US now has lower intergenerational income mobility than almost all DM economies, which risks corroding the social contract on which open markets and creative destruction depend. It has also led to negative social effects, notably a widening of the life expectancy gap between Europe and the US since the 1980s.

3. Why the US Should Remain a Long-Term Success Story
The challenges facing the US are real, but the weight of evidence still suggests it will remain the world’s leading economy for the foreseeable future. Its collective structural advantages remain difficult to replicate, and it retains the same adaptability that’s helped it recover from previous difficulties.
The starting point is that the US should remain the world’s largest economy well beyond the critical decade coming up. A global demographic slowdown means that previous assumptions of rapid population and economic growth in emerging markets no longer look inevitable. Conversely, US economic growth has generally surprised on the upside since the pandemic, with the “secular stagnation” narrative of the 2010s quietly fading. Indeed, the US economy has successfully weathered multiple shocks in recent years, ranging from rapid Fed rate hikes, to tariffs, to the Iran conflict. Moreover, there is further upside potential to productivity growth (and hence economic growth) from the US’ significant lead on AI.
This AI boom is the latest expression of the US capacity for reinvention that stretches back through its history: a willingness to embrace disruptive, capital intensive technology and absorb the dislocation it brings. AI is one of many new technologies that have often led to economic volatility (and boom-bust cycles on occasion), but whose benefits have delivered broad, economy-wide productivity gains over time. That was clear historically with canals, railroads, and electrification, and also with more recent innovations like the internet.
Thus, the US is well-positioned to lead the AI cycle for several mutually reinforcing reasons: an innovation-friendly ecosystem of research universities and venture capital; a cultural and institutional acceptance of the boom-bust investment cycles that frontier technology requires; the deepest capital markets in the world to fund it; and abundant domestic energy. The shale revolution has transformed the US into a net energy exporter, and cheap, plentiful power is now a decisive input advantage in the race to build and run data centres. Few competitors can match this combination.
The AI boost comes at a time when the US has already re-established its productivity outperformance in recent years. Since the pandemic, US productivity growth has risen above its post-1970 average, which in turn is boosting GDP and the revenue base. The potential fiscal arithmetic is powerful. According to CBO estimates, if productivity growth were just half a point above their baseline in the coming decade, then debt held by the public would only rise to 110% rather than 120% by 2036 (see the following DB note on the US debt outlook for more). However, productivity gains alone are unlikely to resolve the fiscal issue, in part because the political incentive is to spend the fiscal dividend rather than save it and in part given the uncertainty of how the gains would be distributed — a theme we return to below.

On demographics, the US also enjoys a clear advantage over its principal rivals. China’s working-age population will begin a pronounced contraction in the 2030s, with Europe in aggregate also seeing a decline, whereas the US will see moderate growth under a normalised migration trend . With a growing working-age population, the US would avoid this drag from a shrinking labor force. Moreover, the US has had a consistent capacity to absorb immigration at levels few other developed economies have managed. And with the demographic slowdown now reaching emerging markets, few major economies now have clearly better longterm demographic potential than the US. For instance, while India will maintain positive demographic momentum over the next couple of decades, with its fertility rate now below replacement rate, its advantage will shrink by the middle of the century.

Even on the financial side, whilst the dollar’s role has come under pressure, it still retains a dominant and unrivalled position. The network effects that sustain it are exceptionally strong, and there is no obvious successor in the wings, unlike when the dollar overtook sterling in the interwar period. The depth and liquidity of US capital markets, inseparable from the dollar’s role, are themselves a structural draw that even US rivals rely upon. Indeed, it is notable that the asset seeing a major increase in official reserves is gold, rather than another currency. And while new payment technologies could bring new risks to dollar dominance, US dominance in the stablecoin space will help limit these risks for the foreseeable future.
The Conditions for Continued Success: Pitfalls to Avoid
Yet much as there are credible reasons for US outperformance to continue, this cannot be taken for granted.
The first key challenge is to ensure that the gains from future technological growth are broad-based, as excessive concentration risks adding to political and institutional dysfunction. We know from history that technological progress does not automatically deliver broadly shared prosperity. For instance, during the early Industrial Revolution, aggregate output rose for decades as wages for ordinary workers stagnated, a period that has been dubbed “Engels’ pause”. This offers a cautionary lesson on AI, and with the labor share of income in the US already near historic lows today, a further deterioration risks intensifying the social and political backlash building against the technology. It’s important to avoid that, as a backlash against technological advances would in turn negate its gains. A related risk is that if AI gains accrue to capital through profit margins while labor is shed, this would negate the fiscal benefits from higher productivity given the focus of the US tax system on labour taxation.
This brings us to the second challenge – managing the fiscal adjustment and the related timing risk. The US is currently running budget deficits at levels previously unprecedented outside of a major recession or war. The ideal scenario would be some sort of bipartisan consensus, as in the early 1990s, to deal with the fiscal challenges ahead in a pre-emptive manner. However, political incentives to reduce deficits appear limited, raising the prospect that it will be up to markets to ultimately force consolidation. The risk is that this could come at a moment of heightened vulnerability, such as a wider economic crisis or recession, resulting in a harsher correction. A degree of financial repression, especially if combined with genuine consolidation, could end up playing a role in managing the debt burden. But a full embrace of that route — in an extreme case, via debt monetisation by the Fed — would merely accelerate the erosion of the dollar’s special status.
The third challenge is protecting the US’ institutional foundations. Institutional stability (and the consistent rule of law and secure property rights underpinning it) have been the bedrock on which the capital-markets and dollar advantages ultimately rest. If that eroded over the coming decades, it would create a more uncertain climate for long-term investments and dampen the international appeal that has attracted top talent and financial capital to the United States.
The fourth challenge is a global one, in that the US has benefited immensely from the post-war system of US leadership. However, that settlement has come under increasing strain in recent years, particularly as emerging markets that have grown in size seek greater influence in global affairs. After all, the US only makes up around 26% of global GDP in USD terms. But with its allies, the influence of the US increases substantially. For instance, the G7 as a whole makes up 44% of global GDP, and if you include further US allies such as Australia and South Korea, its effective alliance network still comprises more than 50% of global GDP in dollar terms. With the US standing as the clear and unsurpassed leader of this group, maintaining this network has enormous benefits.
What will the US’ ongoing success imply, and what are the key takeaways?
To wrap up, let us briefly consider two concluding questions. First, what does the above analysis mean for investors looking at the US over the long term. And second, what lessons can the rest of the world learn from the success of the US model over time.
For those allocating capital, the case for the US as the world’s pre-eminent investment destination remains intact. An investor into the US buys a bundle that is hard to replicate – productivity leadership, the deepest and most liquid capital markets in the world, the rule of law that underpins them, and the flexibility conferred by the dollar’s reserve role. That combination should persist. However, the risk premium around the US has risen, as fiscal strains and a wider geopolitical reshuffling point to a wider distribution of outcomes and bigger tail risks.
In practice, this could play out in several ways. First, the dollar’s “exorbitant privilege” is unlikely to disappear within the next decade, but gradual diversification of both reserves and payments is real and persistent. Already, the dollar’s global importance has ebbed in recent years. These growing question marks around the dollar’s status are the first risk. Second, US equity leadership is now heavily concentrated in a handful of AI-exposed names, so the bull case increasingly rests on a small group of companies, again widening the tail risk outcomes. And third, there is a tail risk of a correlated scenario where a fiscal reckoning coincides with a correction in the AI investment cycle, pressuring equities, duration and the dollar simultaneously, and undermining the diversification that normally cushions portfolios. This is a scenario worth planning for, even if it is not the central case.
What can the rest of the world learn from the US’ success? In part, it is simply down to luck, including geographic advantages and an abundance of resources, such as energy, that cannot be replicated elsewhere. However, there are several features that could be reproduced elsewhere.
The first is its resilient institutional architecture, with a legal system and property rights that have provided a favourable environment for long-term investment. Although the US has faced severe crises in the last 250 years, including a civil war, its system of government has been recognisably the same throughout that time.
Second, it has a well developed financial system, and a tolerance for risk that’s enabled the US to embrace new technologies and emerge quicker from downturns, with resources shifting quickly to new and productive sectors. US history demonstrates how suppressing volatility and preventing resource re-allocation can be counterproductive over the long term.
Third, a key component of US success has been its adaptability to different contexts, and its ability to leverage existing strengths when under pressure. These range across its energy resources, capital markets, universities, military power, reserve currency status, and technological leadership. Even when one point has appeared under threat, others have been able to compensate.
More in the full file available to pro subs.
Tyler Durden
Fri, 07/03/2026 – 15:20